All on the Line · Intelligence
A sequential identifier bridges a public price and a private volume. What London did to German tanks, and does to a loan book.
Statistical inference
5 August 2026
13 minutes

In the early stages of World War II, in June 1940, the conventional American and British estimate of German tank production stood at 1,000 machines a month. But then a small staff at the Economic Warfare Division of the American Embassy in London, reading the serial numbers stamped into the gearboxes of captured tanks, put the figure at just 169. And the records of the Reich Ministry for Weapons and Munitions, later renamed Armaments and War Production, recovered after the war, showed that the real number was 122.1 The same three numbers for June 1941 ran 1,550, 244 and 271, and by August 1942 they stood at 1,550, 327 and 342. Measured against the recovered records the serial estimates initially overshot by two fifths, then undershot by a tenth, then undershot by only four percent, while the intelligence services ran from four and a half to more than eight times the true number in every month tested. While the London staff had no agents, no aerial reconnaissance and no prisoners to interrogate, they made use of mathematics to extract top-secret information that Germany was unable to withhold.
Every German plant stamped a number into the chassis, engine, gearbox and bogie wheels of each tank it shipped, so that a defective component could be traced back to the works that built it and a spare could be matched to the machine that took it. Basic quality control was responsible for the markings, and the markings recorded output. A plant that numbers its gearboxes in the order it builds them turns each month's production into a run of consecutive integers, and every captured tank hands over one number drawn from that run. Recover a handful and the spacing between them measures how much of the run you have not seen. Without realizing it, Germany was publishing its tank output on its own transmissions, and math uncovered it.2
Invoices, purchase orders, policy numbers and loan identifiers are issued in sequence by systems built for internal control rather than for disclosure, and they may reach an outside reader only as a sample, such as the partial file assembled for a preliminary review or an audit. And those samples carry information about the whole data set. Run on those numbers, the same arithmetic London used in World War II can count what a company has issued without asking it anything, and multiplied by a price the company publishes itself, that count becomes money.
Put seven invoices from one supplier on the table, in whatever order they reached you, and read only the numbers: 118, 402, 651, 793, 1,204, 1,502 and 1,842. Ask how many invoices that supplier has issued. The largest number is a floor, since no supplier can have issued fewer invoices than the highest number it has already spent. It is also a biased estimate whose bias has a known size, and that size is sitting in the other six numbers. Sort them and measure the distances between them, counting the first stretch up from zero: 118, 284, 249, 142, 411, 298 and 340. Those seven gaps sum to 1,842, which is an identity rather than a coincidence, since the gaps partition the whole run from zero to the highest number observed. Their average is 1,842 divided by 7, or about 263. Now ask what happened to the eighth gap, meaning the gap between the highest number you got and the highest number the supplier has actually issued. There is a stretch of run past 1,842 that you are not seeing, and on average that stretch is the same size as all the others. Add it back:
N̂ = m + m/k − 1
where m is the highest identifier you hold and k is how many you hold. For these seven invoices that is 1,842 plus 263 minus 1, or about 2,104.3
The estimate closes on itself, which is the quickest way to see it is not arbitrary. If the supplier truly issued 2,104 invoices and seven of them reached you at random, the highest number you should expect to see is 7 times 2,105 divided by 8, which is 1,841.9. You saw 1,842.4 Your sample is precisely what a run of 2,104 produces, and stopping at the highest number you got would have understated that run by 12.5%, the arithmetic consequence of drawing seven times and expecting one of them to be the last invoice ever written. Leo Goodman published the formal treatment in 1952, two years into a career at the University of Chicago spent building rigorous statistics for categorical data, and followed it in 1954 with a paper on running the method in practice. He proved this estimator is the minimum-variance unbiased one: right on average rather than merely close, and tighter than anything else built from the same seven numbers.5
How far you can trust that 2,104 depends steeply on how many numbers you hold. Seven invoices put the likely spread at about 265 either side. Twenty narrow it to about 100, thirty to 67, and sixty-four to 32. Notice how fast it falls. Most statistics improve with the square root of the sample, which is why quadrupling your data only halves the error, and that is the rate behind every average you have ever computed. This estimator improves with the count itself, so doubling the sample halves the spread instead of trimming it by 29%.6
The London staff read numbers off chassis, engines, gearboxes and bogie wheels, and the components were not equivalent. A gearbox gives one number per tank. A set of road wheels gives 32. In February 1944 two captured tanks yielded 64 wheel numbers between them, the largest sample in that table, and the staff put the month's tank production at 270 against German records of 276.7 Two vehicles settled the question because those two vehicles carried 64 numbers. What governs precision is sequenced identifiers rather than objects, so the first question to ask of any partial file is not how many documents it contains but which field inside them was issued in order and how many times that field appears.
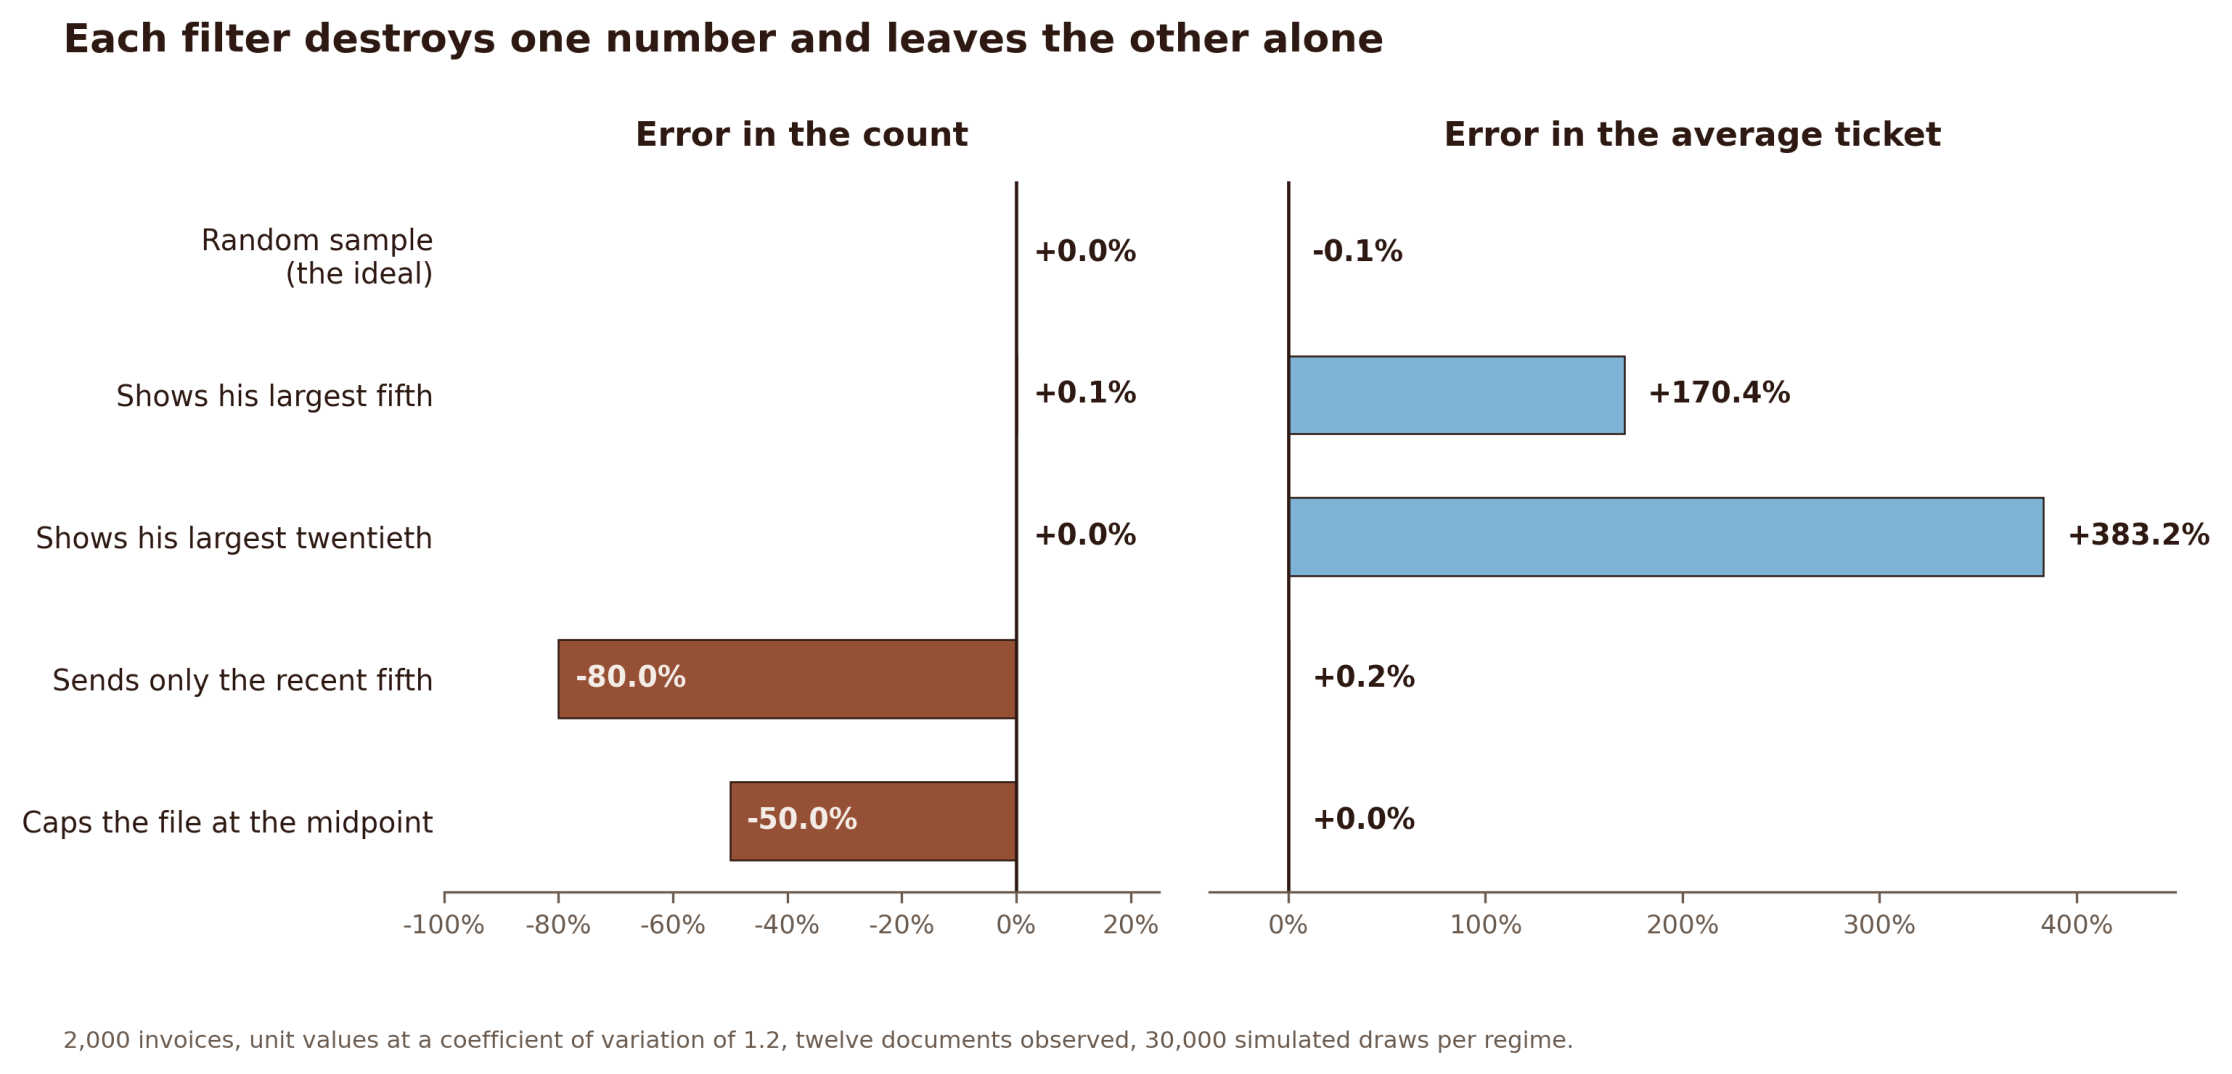
Revenue is a count multiplied by a price. The arithmetic above delivers the count, and where you get the price decides how wrong the answer is. Take it from the documents the counterparty chose to send and it produces a fantasy. Give a supplier 2,000 invoices, let him pick the twelve he shows you from his largest fifth, and the average ticket you compute from those twelve runs 170% above the truth; let him pick from his largest twentieth and it runs 383% high. Over the same twelve documents the count estimate is off by just 0.1%.8 The two statistics read different things. The count estimator reads positions in the run, and a supplier sorting his invoices by value is not sorting them by number, so the twelve he chooses land scattered across the run exactly as a random twelve would. Size and sequence are separate axes, and pressing hard on one leaves the other flat.
So take the price from somewhere he does not control. Rate cards, published product sheets, menu boards, filed tariffs, teardown reports. A price list cannot be cherry-picked at you, because it was written for everybody. That inverts the usual assumption about corporate secrecy: prices are published on purpose, since a company that hides its prices cannot sell, while volumes are the number every company treats as confidential.
Work it on a consumer lender. Loans are numbered in sequence per origination channel. Those identifiers escape constantly through channels the lender does not curate: servicer reports, custodial files, securitization documents, credit bureau records, and the agreement any single borrower can put in front of you. A quarter is a window rather than a whole run, so both ends are unknown and the estimator has to reach out by one average gap in each direction:
N̂ = (xₘₐₓ − xₘᵢₙ)(k + 1)/(k − 1) − 1
Ten identifiers dated inside the quarter return 21,503 originations against a true 21,500, with a spread near 13.5%, and twenty bring it under 7%.9 Now take the average ticket off the lender's own product sheet, 250 dollars. Twenty identifiers put the quarter's origination volume at 5.38 million dollars, with a ninety percent band from 4.7 to 5.8 million. Estimate that same ticket from your twenty documents instead and the error widens to 10.5%, which also hands the counterparty a lever he did not previously have.
Costs yield to the same multiplication, and the London staff got there first. Production count times the known input content of each unit gives resource consumption, which is how serial number analysis fed target selection for the bombing campaign. Teardown services now publish bill-of-materials costs while unit volumes stay private, so identifiers on shipped units convert a public cost per unit into a competitor's cost of goods.
The edges are sharp. Negotiated or dispersed pricing destroys the method, which puts enterprise software, professional services and anything quoted per client outside its reach. It needs the identifier to correspond to a sale, so voids, quotes and multi-line orders have to be estimated and stripped. And a numbering scheme that runs per branch or per channel has to be split at its breaks and sized separately before any of it means anything.10
Luckin Coffee ran this exposure in public and lost. Every order placed in one of its stores generated a pick-up number, issued in sequence and reset each day, so the last number issued is the day's order count. Buy a coffee at opening and the number comes back as 1, which confirms the counter has reset. Buy another at closing and the number it returns is what that store sold, with no estimator required and no caveat attached. Multiply by a ticket anyone can read off the menu board and you have its revenue for the day. In January 2020 an anonymous 89-page report circulated by Muddy Waters did precisely this, supported by more than 11,200 hours of store video and 25,843 collected customer receipts gathered by 92 full-time and 1,418 part-time staff. Luckin had reported 444 items sold per store per day for the third quarter of 2019. The surveys counted 263.11 Its own board later put fabricated 2019 sales at roughly 2.2 billion renminbi, about 310 million dollars.
Luckin then began skipping its order numbers during the day, the one countermeasure that defeats the tracking. Internal staff messages later showed the instruction in plain terms: jump from order 271 straight to 273. Number 272 was never issued to anyone, and the day's total rose by one. A listed company degraded the operating system of its own stores to stop outsiders reading a number it handed to every customer it served. Germany had tried the same thing with blocks reserved by model, and both attempts run into the reason the numbering exists at all. Trace a defective part back to the plant that built it, match a spare to the machine that takes it, notice that invoice 1,204 was never issued, test a period for completeness: all of it requires that things be numbered in the order they happen. Number at random instead and you must maintain a lookup table forever, and you surrender your own ability to see a missing document.
Germany lost its production figures because it could not choose which of its tanks were captured. A company has more control than that and less than it believes, since it chooses what enters a data room and what appears in a management presentation, and chooses nothing at all about the receipts, agreements, confirmations and servicing files already sitting with every counterparty it has ever dealt with, each carrying a number issued in order. So it publishes its prices on purpose, since nothing sells without a price, and it publishes its volumes without meaning to, since no business operates without numbering things in the order they happen. Only the first of those is a decision.
— Carlos E. Mora
I wake up, I build, I repeat. No guarantees.
I work like it’s all on the line, because it is.
Family is the only true legacy.
Your name is your currency, and it must be earned daily.
1.Richard Ruggles and Henry Brodie, "An Empirical Approach to Economic Intelligence in World War II," Journal of the American Statistical Association 42, no. 237 (March 1947): 72–91, Table 1. Monthly tank production, conventional Anglo-American intelligence estimate / serial number analysis / German records: June 1940, 1,000 / 169 / 122; June 1941, 1,550 / 244 / 271; August 1942, 1,550 / 327 / 342. Errors of the serial estimates against the recovered records are +38.5%, −10.0% and −4.4%; the intelligence estimates stood at 8.2, 5.7 and 4.5 times the recovered figures. Three months establish no trend, and Ruggles and Brodie present the period as one in which the technique was still developing. The widely quoted pairing of 246 against 245 is a different quantity: an average monthly rate for June 1940 through September 1942 rather than any single month, and it comes from Gavyn Davies, "How a statistical formula won the war," The Guardian, 20 July 2006, rather than from Ruggles and Brodie. That column also states the estimator as (M−1)(S+1)/S, a near miss for Goodman's form, which returns 109.2 where Goodman returns 109.4 on the same inputs.
2.Ruggles and Brodie describe the Economic Warfare Division beginning work on captured markings in early 1943, starting with tires and extending to tanks, trucks, guns, flying bombs and rockets. Serial numbers were collected from chassis, engines, gearboxes and bogie wheels. Gearbox numbers were preferred because they formed a single unbroken sequence, while chassis numbers were issued in blocks reserved for different models, so gaps in the chassis series recorded a filing convention rather than production. Manufacturer codes had to be solved before a number could be assigned to a plant, and date codes before it could be assigned to a month, after which each month's numbers were re-indexed to a run beginning at 1.
3.The seven gaps, counting the first stretch up from zero, are 118, 284, 249, 142, 411, 298 and 340, summing to 1,842. The sum is an identity: the gaps partition the interval from zero to m, so their mean is always exactly m/k, here 1,842 ÷ 7 = 263.14. The estimator adds one further average gap beyond the observed maximum and subtracts one to correct for the run beginning at 1: 1,842 + 263.14 − 1 = 2,104.14.
4.For k draws without replacement from a population of N, the expected maximum is k(N+1)/(k+1). At N = 2,104 and k = 7 that is 7 × 2,105 ÷ 8 = 1,841.9, against an observed maximum of 1,842. Simulation over 300,000 draws at N = 2,104 and k = 7 returns a mean estimate of 2,104.1, a residual bias of +0.11 units, and a standard deviation of 264.0 against the closed-form 264.7. Taking the maximum alone returns a mean of 1,842.4 across those draws, understating the true run by 12.4%; on the seven invoices in the text the shortfall is 12.5%.
5.Leo A. Goodman (1928–2020) took his doctorate at Princeton at twenty-two under Samuel Wilks and John Tukey, joined the University of Chicago in 1950 and remained thirty-six years before moving to Berkeley. Goodman-Kruskal lambda, gamma and tau are his. The serial number papers are "Serial Number Analysis," JASA 47, no. 260 (1952): 622–634, and "Some Practical Techniques in Serial Number Analysis," JASA 49, no. 265 (1954): 97–112. The 1954 paper includes tests of the uniform-sampling assumption on which the estimator rests.
6.The variance of the estimator is (N − k)(N + 1) / (k(k + 2)). At N = 2,104 the standard deviation runs 264.7 at k = 7, 99.9 at k = 20, 67.5 at k = 30 and 32.0 at k = 64, or 12.58%, 4.75%, 3.21% and 1.52% of the estimate. For k much smaller than N the expression reduces to approximately N²/k², so the relative error falls as roughly one over k rather than one over the square root of k, and doubling the sample halves the spread rather than reducing it by the familiar 1 − 1/√2, or 29.3%.
7.The February 1944 estimate of 270 from 64 road wheels appears in Bob Carruthers, Panther V in Combat (Coda Books, 2012), 94, ISBN 978-1-908538-15-4; the German production figure of 276 is Ruggles and Brodie, 82–83. One caveat the record does not settle: 32 wheels taken from a single tank are unlikely to be 32 independent draws, since wheels fitted together plausibly came from one production batch, which would cluster the observed numbers and bias the estimate downward. The February figure did come in low, but by 2.2%, which is inside the spread expected from an unclustered sample of that size, so the assumption is under strain rather than broken.
8.Simulation, 30,000 draws, population 2,000 invoices, unit values lognormal with a coefficient of variation of 1.2, twelve documents observed. Sampling restricted to the largest twenty percent by value returns a mean ticket 170.4% high and a count 0.1% high; restricted to the largest five percent, 383.2% high on the ticket and 0.0% on the count. Filtering along position rather than value reverses it exactly: the most recent fifth returns the ticket within 0.2% and the count 80.0% low, and a hard cap at the midpoint returns the ticket within 0.1% and the count 50.0% low. The separation holds where ticket size is independent of position in the run and degrades as the two correlate, which is testable by regressing amount on identifier in the documents already held.
9.Where both ends of the run are unknown, the observed spread carries k − 1 internal gaps and the estimator reaches out by one average gap at each end. Simulation over 50,000 draws from a window of 21,500 returns a mean of 21,503 with a relative spread of 22.3% at k = 6, 13.5% at 10, 6.9% at 20 and 3.5% at 40. At 20 identifiers and a fixed ticket of 250 dollars the implied volume is 5.38 million dollars with a 5th-to-95th band of 4.66 to 5.83 million; at 10 identifiers the same ticket gives 5.38 million with a band of 3.97 to 6.33 million. Substituting a ticket estimated from the same 20 documents, at a coefficient of variation of 0.35, widens the error from 6.9% to 10.5%.
10.Steven J. Miller, Kishan Sharma and Andrew K. Yang, "The German Tank Problem with Multiple Factories," The PUMP Journal of Undergraduate Research 7 (2024): 231–257, also arXiv:2403.14881, which handles production running in disjoint ranges by identifying which samples belong to which factory, estimating each range separately and summing. The window estimator used above is Clark, Gonye and Miller's unknown-minimum form, published there as Ŝ(1 + 2/(k − 1)) − 1, algebraically identical to the (k + 1)/(k − 1) expression used in the text.
11.The 89-page anonymous report was circulated by Muddy Waters Research on 31 January 2020: more than 11,200 hours of store video and 25,843 customer receipts, collected by 92 full-time and 1,418 part-time staff. Reported store counts vary across accounts of the report, from 620 stores under traffic recording to 981 under round-the-clock survey, with the order-number bracketing run on a subset. Luckin reported 444 items per store per day for 2019 Q3 against 263 observed, an inflation of 69%, with Q4 inflated by 88%. The order-skipping instruction, jumping from number 271 to 273, appears in internal staff messages described in Yimin Chen, "Analysis of Financial Fraud and Audit Implications of Luckin Coffee" (IEMESSC 2023), and in "Financial Fraud of Listed Companies: The Case of Luckin," which records the same practice as jumping the number when picking up the meal code. Luckin's board investigation announced 2 April 2020 identified approximately RMB 2.2 billion in fabricated 2019 sales, roughly 310 million US dollars at prevailing rates.
The arithmetic in these essays is the arithmetic the practice runs on a mandate.
Discuss a mandate →