All on the Line · Infrastructure
AI infrastructure is funded. The grid is not. Why the physical constraint no one is pricing may determine whether AGI arrives on schedule.
The economics of power to compute
6 May 2026
21 minutes
On any given Tuesday in 2026, someone opens a laptop and uses an AI the way a previous generation used a search engine — except the interaction is longer, the output is richer, and it happens more often. In the morning, they ask it to summarize a report before a meeting. At lunch, they draft a difficult email to a client. In the afternoon, they ask it to explain a clause in a contract, check whether a connection leaves enough time between flights, and help structure a presentation they have been putting off for a week. By the time they close the laptop, they have had roughly twenty exchanges with the system across three sessions.
Those twenty exchanges generated approximately 16,000 tokens.1 And behind that consumption — behind those three sessions and the feeling of frictionless intelligence — sits the most capital intensive industrial buildout in the history of the private economy.
The numbers involved dwarf every major industrial and infrastructure program in American history — individually and combined.2 This column is not an analysis of artificial intelligence as a technology. It is not an assessment of what these systems can do, how they reason, or how close they are to human cognition. Those are important questions and other people are better positioned to answer them. This column is an attempt to do something more uncomfortable: to apply the same mathematical discipline that governs any capital-intensive industrial system to the one being built right now at a speed and scale that has no historical precedent — and to ask whether the economics actually close. Whether the physical infrastructure required to power what is being promised can be built on the timeline the capital assumes. Whether what is being described as the most transformative technology in human history is being funded with the efficiency it demands.
A token is a unit of computation — a compressed fragment of language, roughly three-quarters of a word in English, that a neural network processes as a discrete mathematical object.3 What happens between the moment a user submits a prompt and the moment a response appears is a sequence of matrix multiplications executed across thousands of processing cores. For a model with seventy billion parameters — the scale of the frontier inference models most widely deployed as of 2026 — each token generated requires on the order of 140 billion floating-point operations (FLOPs).4 The speed feels instantaneous. The arithmetic is not reduced by that speed. Every floating-point operation still occurs. Every one consumes energy.
An NVIDIA H100 GPU draws approximately 700 watts under realistic inference workloads and processes roughly 24,000 tokens per second on a seventy-billion-parameter model at measured utilization.5 The energy cost at the chip is therefore approximately 0.10 joules per token. After accounting for the cooling systems, power conversion equipment, and facility overhead that every data center requires — measured by the industry as Power Usage Effectiveness, or PUE, which runs between 1.2 and 1.5 at hyperscaler facilities6 — the actual draw from the grid is approximately 2,160 joules for one user’s Tuesday. Taken alone that number is unremarkable. Multiplied across the estimated 300 million people using AI assistants daily across all major platforms — ChatGPT, Gemini, Copilot, Claude, Grok, and others — it becomes approximately 180,000 megawatt-hours of electricity consumed in a single day from conversational AI interactions alone.7 That is enough electricity to power approximately 6 million American homes for a full day.
That number is not what makes this interesting. What makes it interesting is that it is being multiplied simultaneously by two compounding growth rates that do not cancel each other and have no natural ceiling in sight.
The first is users. ChatGPT alone reported 900 million weekly active users as of early 2026, more than double the figure twelve months earlier.8 The second is tokens per user per day. In 2023, the typical AI interaction was occasional and exploratory. In 2026, it is continuous and functional. AI agents — systems that execute tasks autonomously on a user’s behalf, without requiring a prompt or a keypress — are beginning to multiply this figure again, because an agent running in the background consumes tokens whether or not its user is at a keyboard.
The mechanism that governs the relationship between these two growth rates and total energy demand was identified in 1865 by the economist William Stanley Jevons, studying coal consumption as steam engine efficiency improved. He observed that more efficient engines did not reduce total coal consumption — they reduced the cost of coal-powered work, which expanded the range of applications viable for steam power, which increased total consumption. Efficiency did not shrink the market. It grew it. The same mechanism operates in AI token consumption with unusual force: as inference costs fall — the population of economically viable use cases expands faster than the per-unit cost declines, and total energy demand rises even as energy per token falls.
US data centers consumed 183 terawatt-hours of electricity in 2024 — roughly equivalent to the annual electricity demand of Pakistan.9 The IEA projects that figure will double by 2030 in its base case, and triple for AI-focused data centers specifically. Goldman Sachs projects a 165% increase in data center power demand by 2030 versus 2023.10 Both projections were made before the full adoption of agentic AI systems, which Morgan Stanley estimates require twelve times more processing overhead per session than conversational chatbots.11 The inference cost deflation driving this expansion is itself without precedent: a 280-fold reduction in the cost of equivalent AI capability between late 2022 and late 2024, continuing through 2025 at rates Epoch AI estimates at nine to 900 times per year.12
The chain, stated completely, runs as follows. A token requires floating-point operations. Floating-point operations require chips. Chips require data centers. Data centers require electricity. Electricity requires generation. Generation requires transmission. Transmission requires permits. Permits require time. And time, unlike capital, cannot be deployed faster by deciding to spend more of it.
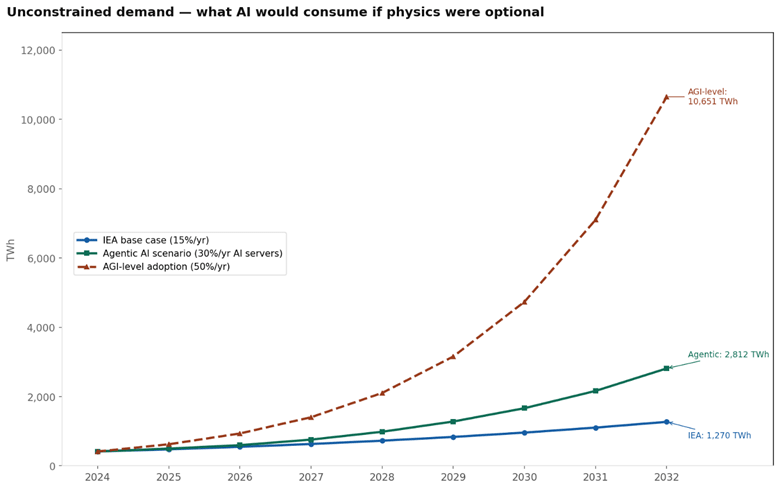
Chart 1: What AI would consume if the only limit were demand. Three scenarios — conservative IEA base case (15%/yr), agentic AI (30%/yr), and AGI-level adoption (50%/yr) — show global data center electricity demand in terawatt-hours from 2024 to 2032, uncapped by any physical supply constraint. Even the most conservative scenario doubles current consumption by 2030. The chart is not a forecast. It is the demand side of the equation before physics enters the room.
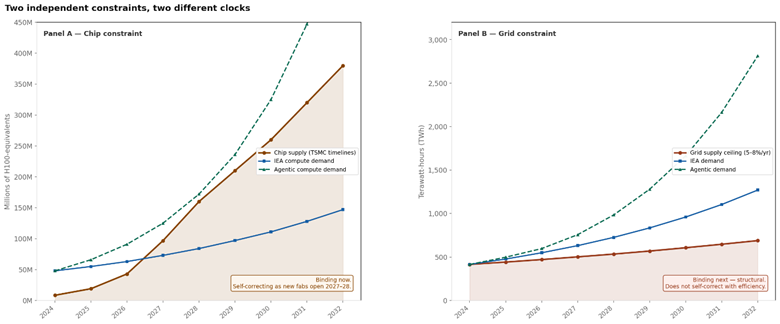
Chart 2: The same demand lines, now measured against what the physical supply of each constraint can actually deliver. Panel A shows chip supply in millions of H100-equivalents — growing fast, partially self-correcting as new TSMC fabs come online in 2027–2028. Panel B shows grid supply in terawatt-hours — growing slowly, bounded by interconnection queues and transmission timelines that cannot be shortened by capital alone. The chip constraint is the immediate bottleneck. The grid constraint is the structural one. The key observation: by the time chip supply catches up with demand around 2027–2028, the grid becomes the binding constraint — and it does not self-correct.
There are three distinct physical layers in the AI infrastructure stack, and each operates on a different construction timeline. Understanding the difference between those timelines is the prerequisite for understanding where the capital currently being committed will — and will not — arrive on schedule.
The first layer is chips. An NVIDIA H100 GPU costs approximately $30,000 to $40,000. Its successor generations deliver progressively more compute per watt, which means each generation requires fewer chips and less electricity per unit of intelligence produced. TSMC, which manufactures the overwhelming majority of the world’s advanced AI chips, is building new fabs in Arizona, Germany, and Japan with volume production expected in 2027 and 2028, and has committed $165 billion to its US expansion alone.13 The chip constraint is real and binding today — H100 rental prices rose roughly 30% between November 2024 and early 2026 as customers unable to access newer generations reverted to older hardware14 — but it is self-correcting. Better chips do more per watt. New fabs come online. The constraint eases as technology advances.
The second layer is data centers. A hyperscaler data center takes eighteen to thirty-six months to design, permit, and construct in favorable jurisdictions. Google, Amazon, Microsoft, Meta, and Oracle — the five largest hyperscalers — committed a combined $690 billion in capital expenditure for 2026 alone, nearly double 2025 levels, with the majority directed at data center construction. Google committed between $175 billion and $185 billion for 2026, including $40 billion for three new Texas data centers through 2027. This layer is moving at the speed of capital and construction. It is the fastest layer to scale, although lately it has started to experience some political opposition.
The third layer is the grid. Generation, transmission, and distribution infrastructure operates on a timeline that neither capital nor engineering can accelerate past a physical and regulatory minimum. A new high-voltage transmission line in the United States takes seven to ten years from planning to energization. A new gas-fired combined-cycle plant takes three to five years. A nuclear plant takes ten to fifteen. The median time from an interconnection request to commercial operation for any new power project in the United States is currently four to five years, more than double from under two years for projects completed in the early 2000s. As of the end of 2024, approximately 2,300 gigawatts of generation and storage capacity were actively waiting in US interconnection queues — more than twice the country’s current total installed generating capacity.15 That pipeline documents the scale of ambition. It does not shorten the timelines. The physical constraints described above apply to every project in it regardless of queue position, and of those that entered the queue between 2000 and 2019, only 13% had reached commercial operation by end of 2024.
The handoff between these three clocks produces the system’s central paradox. Chips are the binding constraint today — but they are self-correcting. As new TSMC fabs come online in 2027 and 2028 and efficiency gains reduce chips required per token, the chip constraint eases. At precisely that moment, the grid constraint becomes dominant — and unlike the chip constraint, it does not self-correct with efficiency gains. Efficiency makes tokens cheaper, which expands demand through the Jevons mechanism, which increases total electricity consumption even as consumption per token falls. The capital is flowing to the layers that move fastest. The layer that moves slowest — the one governed by permits and physics — is receiving the least.
This is where the AGI scenario sharpens from ambition into arithmetic. Epoch AI estimates that reaching the lower bound of the compute threshold required for a single AGI-level training run — approximately 20 million H100-equivalents — will occur around 2028 on the current supply trajectory, as available compute grows at roughly 2.25 times per year from its 2024 base of 8.5 million H100-equivalents. But powering a cluster of 20 million H100-equivalents simultaneously requires approximately 34 gigawatts of continuous electricity — roughly equivalent to the entire electricity consumption of Norway — when accounting for full system power including supporting hardware, cooling, and data center overhead. By 2028 — when available compute crosses that threshold — the maximum power deliverable to a single data center site on optimistic projections is approximately 0.9 gigawatts. The grid delivers roughly 3% of what the compute demands.
The paradox is precise: the compute and the power requirement arrive on different clocks. The compute timeline is governed by chip manufacturing, which is accelerating. The power timeline is governed by grid construction, which is not. By 2028, the compute may exist. The 34 gigawatts required to turn it on will still be years away from delivery. The constraint is not intellectual. It was set in motion, in permitting offices and interconnection queues, years before the training run was scheduled.

Chart 3: The AGI paradox in gigawatts. The blue line shows the power that available AI compute would require if running simultaneously — growing at 2.25 times per year from 1.4 GW in 2024 to approximately 950 GW by 2032, using full system power of 1,700 watts per H100-equivalent as estimated by Epoch AI (chip plus supporting hardware, cooling, and data center overhead). The green dashed line shows the maximum power actually deliverable to a single AI training cluster, growing at an optimistic 15% per year from 0.5 GW today. The two amber horizontal lines mark the AGI power thresholds using full system power: 34 GW for the lower bound (20 million H100-equivalents) and 680 GW for the upper bound (400 million H100-equivalents). The blue line crosses the lower threshold in 2028 — at which point the grid delivers approximately 0.9 GW to a single site, or roughly 3% of what is needed. It crosses the upper threshold around 2031–2032 — at which point the grid delivers approximately 1.4 GW, or 0.2% of what is needed. The compute arrives. The power does not.
The mental experiment this column proposes is straightforward in structure. Take three physical layers — chips, data centers, and grid. For each layer, calculate the investment required under three scenarios (two from projections from authoritative sources and the third one derived), all on the same 2026–2030 five-year horizon: the Goldman Sachs baseline, the McKinsey baseline, and an AGI scenario derived from first principles. Then compare the required investment against what is actually being committed — using the most optimistic reasonable assumptions for committed capital. The exercise produces two findings, which is why it requires two charts.
The two authoritative published baselines are as follows. McKinsey’s April 2025 analysis projects $6.7 trillion of total AI infrastructure investment required through 2030, decomposed as $3.1 trillion for chips and silicon, $1.3 trillion for grid and energy infrastructure, and $800 billion for physical data center construction, with the remaining $1.5 trillion representing traditional IT capex outside the three AI-specific layers.16 Goldman Sachs’ April 2026 baseline projects $7.6 trillion cumulatively through 2031, with annual capex growing from $765 billion in 2026 to $1.6 trillion in 2031.17 Subtracting the 2031 year alone yields approximately $6.0 trillion for the comparable 2026–2030 period — slightly below McKinsey’s figure, reflecting different model anchors and assumptions.
Neither baseline models AGI. That scenario requires a separate derivation. Epoch AI estimates the lower bound of the compute threshold for a single AGI-level training run at approximately 20 million H100-equivalents. At a current cost of approximately $35,000 per GPU, that is $700 billion in silicon alone for a single training run — nearly equal to Goldman Sachs’ entire projected annual capex for 2026. Applying Goldman Sachs’ own data center unit cost of $15 million per megawatt to the 34 gigawatts required to power that cluster yields $510 billion in dedicated data center infrastructure. Power infrastructure at Goldman Sachs’ assumed $2,500 per kilowatt adds a further $85 billion. A single lower-bound AGI training run therefore requires approximately $1.3 trillion in purpose-built infrastructure. Projected over the 2026–2030 horizon assuming one AGI-level training run per year with supporting inference infrastructure, total capital requirement reaches approximately $12 to $14 trillion.18
The committed investment figures are drawn from public filings, earnings calls, and announced partnerships — taken at their most optimistic, on the same 2026–2030 horizon. Hyperscaler capex at 25% annual growth totals approximately $4.0 to $4.5 trillion. Global semiconductor industry capex at 20% annual growth from its $200 billion 2026 base totals approximately $1.5 trillion. Grid investment actually committed totals approximately $400 to $500 billion. The aggregate across all three layers on the most optimistic assumptions is approximately $6.0 to $6.5 trillion — with $6.5 trillion used as the optimistic ceiling.
The first finding is reassuring at the headline level and dangerous beneath it. At the aggregate, committed capital of $6.5 trillion exceeds Goldman Sachs’ 2026–2030 figure of $6.0 trillion and McKinsey’s AI-specific requirement of $5.2 trillion. The base case appears funded at the aggregate level. The AGI scenario is not — the gap between $6.5 trillion committed and $12 to $14 trillion required is $5.5 to $7.5 trillion. That is the total picture and to cover that gap it would require the largest public-private partnership commitment the world has ever seen.
The second finding is the one that matters for the base case. The distribution of committed capital across the three layers is structurally misaligned with the requirement — and the misalignment is concentrated in the layer that cannot be corrected after the fact. Data centers are receiving approximately 69% of committed capital while representing approximately 15% of the McKinsey AI-specific layer requirement. The grid is receiving approximately 8% of committed capital while representing approximately 25% of the McKinsey AI-specific layer requirement. The money is there. It is going to the fastest layer to build and away from the slowest. By the time the misallocation becomes operationally visible — when built data centers cannot run at capacity because the transmission infrastructure is not ready — no capital decision made at that point can close the gap. The grid’s clock does not respond to urgency. It responds to permits. And permits were needed years earlier.
Google has seen this math. The evidence is in its capital allocation. The December 2025 acquisition of Intersect Power for $4.75 billion — bringing multiple gigawatts of solar and storage projects directly onto Google’s balance sheet — is not a sustainability commitment. It is the response of a company that has concluded the grid layer in the capital stack cannot be filled by waiting for utilities to act. The August 2025 collaboration with Kairos Power and the Tennessee Valley Authority to deploy the first Generation IV advanced nuclear reactor connected to the US grid, under a 500-megawatt nuclear capacity initiative, is the same conclusion applied to firm baseload power. The $40 billion commitment to three Texas data centers through 2027, structured with co-located power generation rather than grid connection, is the third expression of the same insight: the interconnection queue is not a temporary inconvenience. It is a structural feature of the US grid that no company building at this scale can afford to treat as someone else’s problem.
The IEA reported in April 2026 that conditional offtake agreements between data center operators and small modular reactor projects grew from 25 gigawatts at the end of 2024 to 45 gigawatts in a single year. That is not a policy development. It is a capital allocation signal from the companies that have done this calculation and arrived at the same answer: the grid gap is real, it is structural, and it cannot be closed through the conventional interconnection process on any timeline that the data center construction schedule requires.
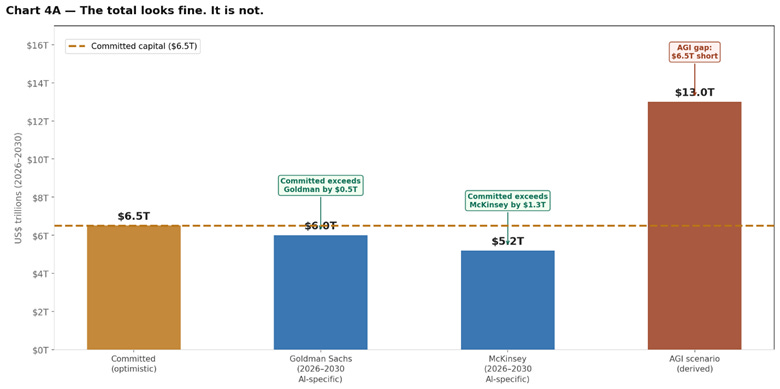
Chart 4A: Four bars on the same 2026–2030 horizon, all on an AI-specific basis: committed capital ($6.5T), Goldman Sachs baseline ($6.0T), McKinsey AI-specific baseline ($5.2T, excluding $1.5T of traditional IT capex), and AGI scenario derived from first principles ($13T midpoint). The amber dashed line marks committed capital at $6.5T. At the aggregate level, committed capital not only covers both published base cases — it exceeds Goldman Sachs by $0.5T and McKinsey’s AI-specific requirement by $1.3T. The AGI scenario is a different story: the gap is $6.5T. But aggregate adequacy is the wrong conclusion to draw. The money is there for the base case. The question is where it is going. That is in Chart 4B. Sources: McKinsey (2025), Goldman Sachs (2026), Epoch AI (2025), company filings. AGI scenario is a first-principles derivation — not a published figure.
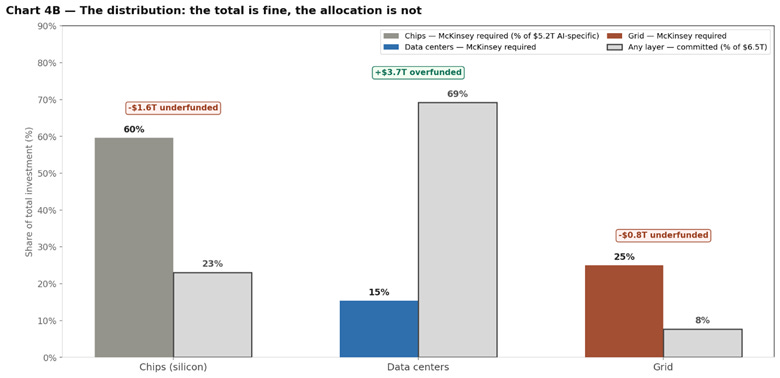
Chart 4B: The distribution. This is the finding. Colored bars show what McKinsey’s AI-specific layer requirement looks like as a percentage of the $5.2T AI-specific total. Gray bars show how committed capital is actually allocated as a percentage of the $6.5T committed total. Data centers receive 69% of committed capital but represent only 15% of the requirement — overfunded by $3.7T. Chips receive 23% of committed capital but represent 60% of the requirement — underfunded by $1.6T. The grid receives 8% of committed capital but represents 25% of the requirement — underfunded by $0.8T. The grid deficit is the most consequential: it is the only layer whose shortfall cannot be corrected after the fact. Sources: McKinsey (2025), company filings.
Return to the person at the laptop. The 16,000 tokens. The three sessions that felt like nothing.
That Tuesday is the demand signal of the most capital intensive industrial buildout in the history of the private economy. The total capital being committed — approximately $6.5 trillion through 2030 on optimistic assumptions — is roughly adequate for the base case. It is not adequate for AGI, where the gap reaches $6.5 to $7.5 trillion. But the more important finding is not the total. It is the distribution. The capital is flowing to the layer that builds fastest and away from the layer that builds slowest. Data centers get built in thirty-six months. Transmission lines take seven to ten years. And the grid, receiving 8% of committed capital against 25% of the requirement, is the only layer where a funding gap today cannot be corrected by a decision made tomorrow.
You can add a data center in thirty-six months. You can add chip capacity in twenty-four to thirty-six months as new fabs come online. You cannot add a transmission line in under seven years. You cannot add a nuclear plant in under ten. The grid is the only layer in the capital stack where a funding gap today produces a physical gap in 2029 that no decision made in 2028 can close.
The public conversation about AGI is almost entirely about intelligence — about whether the models are capable enough, safe enough, aligned enough. Those are important questions. But they are not the binding question on the timeline the capital currently assumes. The binding question is physical. It is measurable. It is visible in interconnection queue data, in PJM (Pennsylvania-New Jersey-Maryland Interconnection) capacity auction prices that rose eleven-fold in two years, in the CEO of TSMC saying there are no shortcuts and a new fab takes two to three years, in 45 gigawatts of nuclear offtake agreements that exist on paper and not yet in the ground.
Ask not if we can build AGI models. The models are being built. Ask if we can power them — on the timeline the capital stack assumes, at the scale the demand curve requires, through the physical infrastructure whose clock speed has never, in the entire history of American industrial development, been governed by the urgency of the private sector alone.
— Carlos E. Mora
I wake up, I build, I repeat. No guarantees.
I work like it’s all on the line, because it is.
Family is the only true legacy.
Your name is your currency, and it must be earned daily.
1.OpenAI’s May 2025 study of 1.5 million conversations found that the average daily active user conducts approximately twenty interactions per day across multiple sessions, with average session length of twelve to fourteen minutes. A typical exchange runs between 500 and 1,500 tokens depending on task complexity. 16,000 tokens per day represents a conservative midpoint estimate for a user conducting a mix of question-answering (49%), task completion (40%), and exploratory interactions (11%). Source: OpenAI, How People Are Using ChatGPT, May 2025.
2.The Interstate Highway System cost approximately $634 billion in 2024 dollars, and took thirty-five years to build. Source: Wikipedia, Interstate Highway System, citing Federal Highway Administration data. The Apollo program cost approximately $288 billion in inflation-adjusted dollars. Source: The Planetary Society, Reconstructing the Cost of the One Giant Leap. The Manhattan Project cost approximately $30 billion in 2024 dollars. Source: Congressional Research Service. Combined: approximately $952 billion in 2024 dollars across all three programs. In 2025, US technology capital expenditure as a share of GDP reached approximately 1.9% — comparable in scale to all three of those programs combined, in a single year. Source: KobeissiLetter analysis of BEA data, 2025; Empower Investment Insights, The AI Revolution Rolls On, 2026. The five-year AI infrastructure requirement of $6.7 to $12 trillion (McKinsey and Goldman Sachs, see notes 16 and 17) exceeds this by an order of magnitude.
3.One token corresponds to approximately four characters of English text, or roughly three-quarters of a word. OpenAI’s Tiktoken library confirms this ratio for GPT-family models.
4.The standard approximation for inference compute in a transformer model is 2N floating-point operations per token per forward pass, where N is the number of model parameters. For a 70-billion-parameter model: 2 × 7 × 10¹⁰ = 1.4 × 10¹¹ FLOPs per token. This figure is consistent with the MLPerf Inference v4.1 benchmarks for the Llama-2 70B model. Larger frontier models — including mixture-of-experts architectures that activate a subset of parameters per token — may require significantly more or fewer effective FLOPs depending on architecture. The 70B figure is used here as the empirically grounded benchmark for which measured performance data exists.
5.MLPerf Inference v4.1 benchmarks for Llama-2 70B in offline configuration report approximately 24,525 tokens per second on a single H100-SXM GPU at approximately 700 watts, corresponding to 0.029 milliwatt-hours per token (0.10 joules per token). Source: ScienceDirect, Green AI Techniques for Reducing Energy Consumption in AI Systems, December 2025.
6.PUE (Power Usage Effectiveness) is the ratio of total data center facility energy to IT equipment energy. A PUE of 1.0 is the theoretical minimum. Hyperscaler facilities report PUEs of 1.2–1.4. Google has reported a trailing twelve-month average PUE of 1.10 for its global fleet. A midpoint of 1.35 is used here as a conservative estimate between the hyperscaler best case and the broader industry average of approximately 1.5–1.6.
7.Total AI assistant daily active users estimated at approximately 300 million across all major platforms. Methodology: DataReportal’s Digital 2026 Global Overview Report estimates more than 1 billion people use AI monthly across platforms including ChatGPT, Gemini, Copilot, Claude, Grok, DeepSeek, and others. Applying a daily-to-monthly active user ratio of approximately 30% — consistent with the 193 million daily active users reported for ChatGPT against its approximately 900 million weekly active user base — yields approximately 300 million daily active users industry-wide. Platform-specific anchors: ChatGPT 193 million daily active users (DemandSage, citing OpenAI, February 2026); Google Gemini approximately 750 million monthly active users (DemandSage, 2026), implying approximately 35 million daily active users at a 5% daily ratio consistent with Gemini’s reported engagement patterns; Microsoft Copilot, Grok, Claude, and others collectively account for the remainder. Aggregate daily grid draw calculation: 300,000,000 users × 2,160 joules per user = 648,000,000,000 joules ÷ 3,600,000 joules per MWh = approximately 180,000 MWh = 180 GWh per day. Average US household daily electricity consumption: approximately 30 kWh per day (EIA, Residential Energy Consumption Survey). 180,000,000 kWh ÷ 30 kWh per home = approximately 6 million homes. This figure covers conversational inference only and excludes training runs, API calls, enterprise batch workloads, and embedded AI in productivity software — all of which represent substantial additional consumption not captured here.
8.ChatGPT weekly active users: 900 million as of February 2026, versus 400 million in February 2025. ChatGPT processes approximately 2.5 billion queries per day as of July 2025. Source: DemandSage, ChatGPT Statistics, March 2026.
9.IEA, Energy and AI, April 2025. US data center electricity consumption of 182.61 TWh in 2024. Pakistan total electricity consumption approximately 180–190 TWh in the same period. IEA Key Questions on Energy and AI, April 2026: data center electricity demand soared 17% in 2025.
10.Goldman Sachs Research, AI to Drive 165% Increase in Data Center Power Demand by 2030, February 2025. Goldman Sachs base case: global electricity generation for data centers rises from 460 TWh in 2024 to more than 1,000 TWh in 2030.
11.Morgan Stanley estimates agentic AI systems require approximately one CPU for every GPU, compared with one to twelve for chatbot systems — implying a twelve-fold increase in processing overhead per session as agent usage proliferates. Source: The Economist, Silicon Ceiling, May 2026.
12.The cost of querying an AI model performing at GPT-3.5 level on the MMLU benchmark fell from $20 per million tokens in November 2022 to $0.07 per million tokens by October 2024 — a 280-fold reduction in approximately eighteen months. Source: Stanford HAI, AI Index Report 2025, Chapter 1: Research and Development. The deflation has continued through 2025: Epoch AI estimates LLM inference costs are falling between nine and 900 times per year depending on the task and capability level. The Jevons paradox (The Coal Question, 1865) holds that efficiency gains in resource use tend to increase rather than decrease total consumption by expanding the economic viability of the resource. IEA, Key Questions on Energy and AI, April 2026, confirms: “power consumption per AI task is declining rapidly... however, more people are using AI, and energy-intensive uses — such as AI agents — are on the rise.”
13.TSMC announced in March 2025 an expansion of its US investment to $165 billion, including three new fabs, two advanced packaging facilities, and an R&D center in Arizona. 2026 capex guidance: $52–56 billion. High-volume manufacturing at Arizona Fab 2 (3nm): expected second half 2027. Source: TSMC SEC Form 6-K, March 2025.
14.H100 GPU rental price increase of approximately 30% since November 2024. All three major HBM producers — SK Hynix, Samsung, and Micron — report most of their 2026 supply is sold out. Source: The Economist, Silicon Ceiling, May 2026, citing SemiAnalysis.
15.Lawrence Berkeley National Laboratory, Queued Up: 2025 Edition. Of the 2,300 GW in active US interconnection queues as of end of 2024, only 13% of projects that entered the queue between 2000 and 2019 had reached commercial operation by end of 2024. The queue documents ambition, not delivery. Physical construction timelines — four-to-five-year median interconnection wait, seven to ten years for transmission, three to five years for gas generation, ten to fifteen for nuclear — apply to every project in it regardless of queue position.
16.McKinsey, The Cost of Compute: A $7 Trillion Race to Scale Data Centers, April 2025. Total AI infrastructure investment required through 2030: $6.7 trillion. Decomposition: technology developers and silicon suppliers $3.1 trillion (60%); energisers — utilities and power providers — $1.3 trillion (25%); builders — physical construction — $0.8 trillion (15%).
17.Goldman Sachs, Tracking Trillions: The Assumptions Shaping the Scale of the AI Build-Out, April 2026. Baseline cumulative capex 2026–2031: approximately $7.6 trillion. Annual capex: $765 billion in 2026 growing to $1.6 trillion in 2031. Key unit cost assumptions used in this column’s AGI derivation: $15 million per MW for data centers; $2,500 per kW for new power infrastructure; PUE of 1.2. To standardize to the 2026–2030 horizon used throughout this column: $7.6T cumulative minus $1.6T for 2031 = approximately $6.0T for 2026–2030. Goldman Sachs notes this is a scenario-based framework, not a forecast.
18.AGI scenario capital requirement derived from first principles using Goldman Sachs’ own unit cost assumptions (Goldman Sachs, Tracking Trillions, April 2026) and Epoch AI’s published compute threshold. All figures on 2026–2030 horizon. Inputs per training run: (1) Silicon: 20M H100-equivalents × $35,000 = $700B. (2) Data centers: 34,000 MW × $15M per MW = $510B. (3) Power infrastructure: 34,000,000 kW × $2,500 per kW = $85B. Single training run total: approximately $1.3T. Projected over 2026–2030 assuming one AGI-level training run per year plus supporting inference infrastructure at comparable scale: approximately $12–14T total, with $13T used as midpoint. This is the column’s own derivation, not a published figure, and is labeled as such throughout. Committed capital (2026–2030, optimistic): hyperscaler capex at 25% annual growth = $4.0–4.5T; semiconductor industry at 20%/yr from $200B base = $1.5T; grid committed = $0.4–0.5T. Total: $6.0–6.5T, with $6.5T used as optimistic ceiling. Committed capital vs McKinsey AI-specific layers ($5.2T): committed exceeds by $1.3T. Committed capital vs Goldman Sachs 2026–2030 ($6.0T, AI-specific): committed exceeds by $0.5T. In both base cases aggregate committed capital is sufficient — the deficit is not in the total but in the distribution across layers. Gap vs AGI scenario: approximately $6.5T ($13T required minus $6.5T committed).
The arithmetic in these essays is the arithmetic the practice runs on a mandate.
Discuss a mandate →