All on the Line · Dealmaking
Why an acquirer’s first years above or below its benchmark cannot tell a good deal from a bad one.
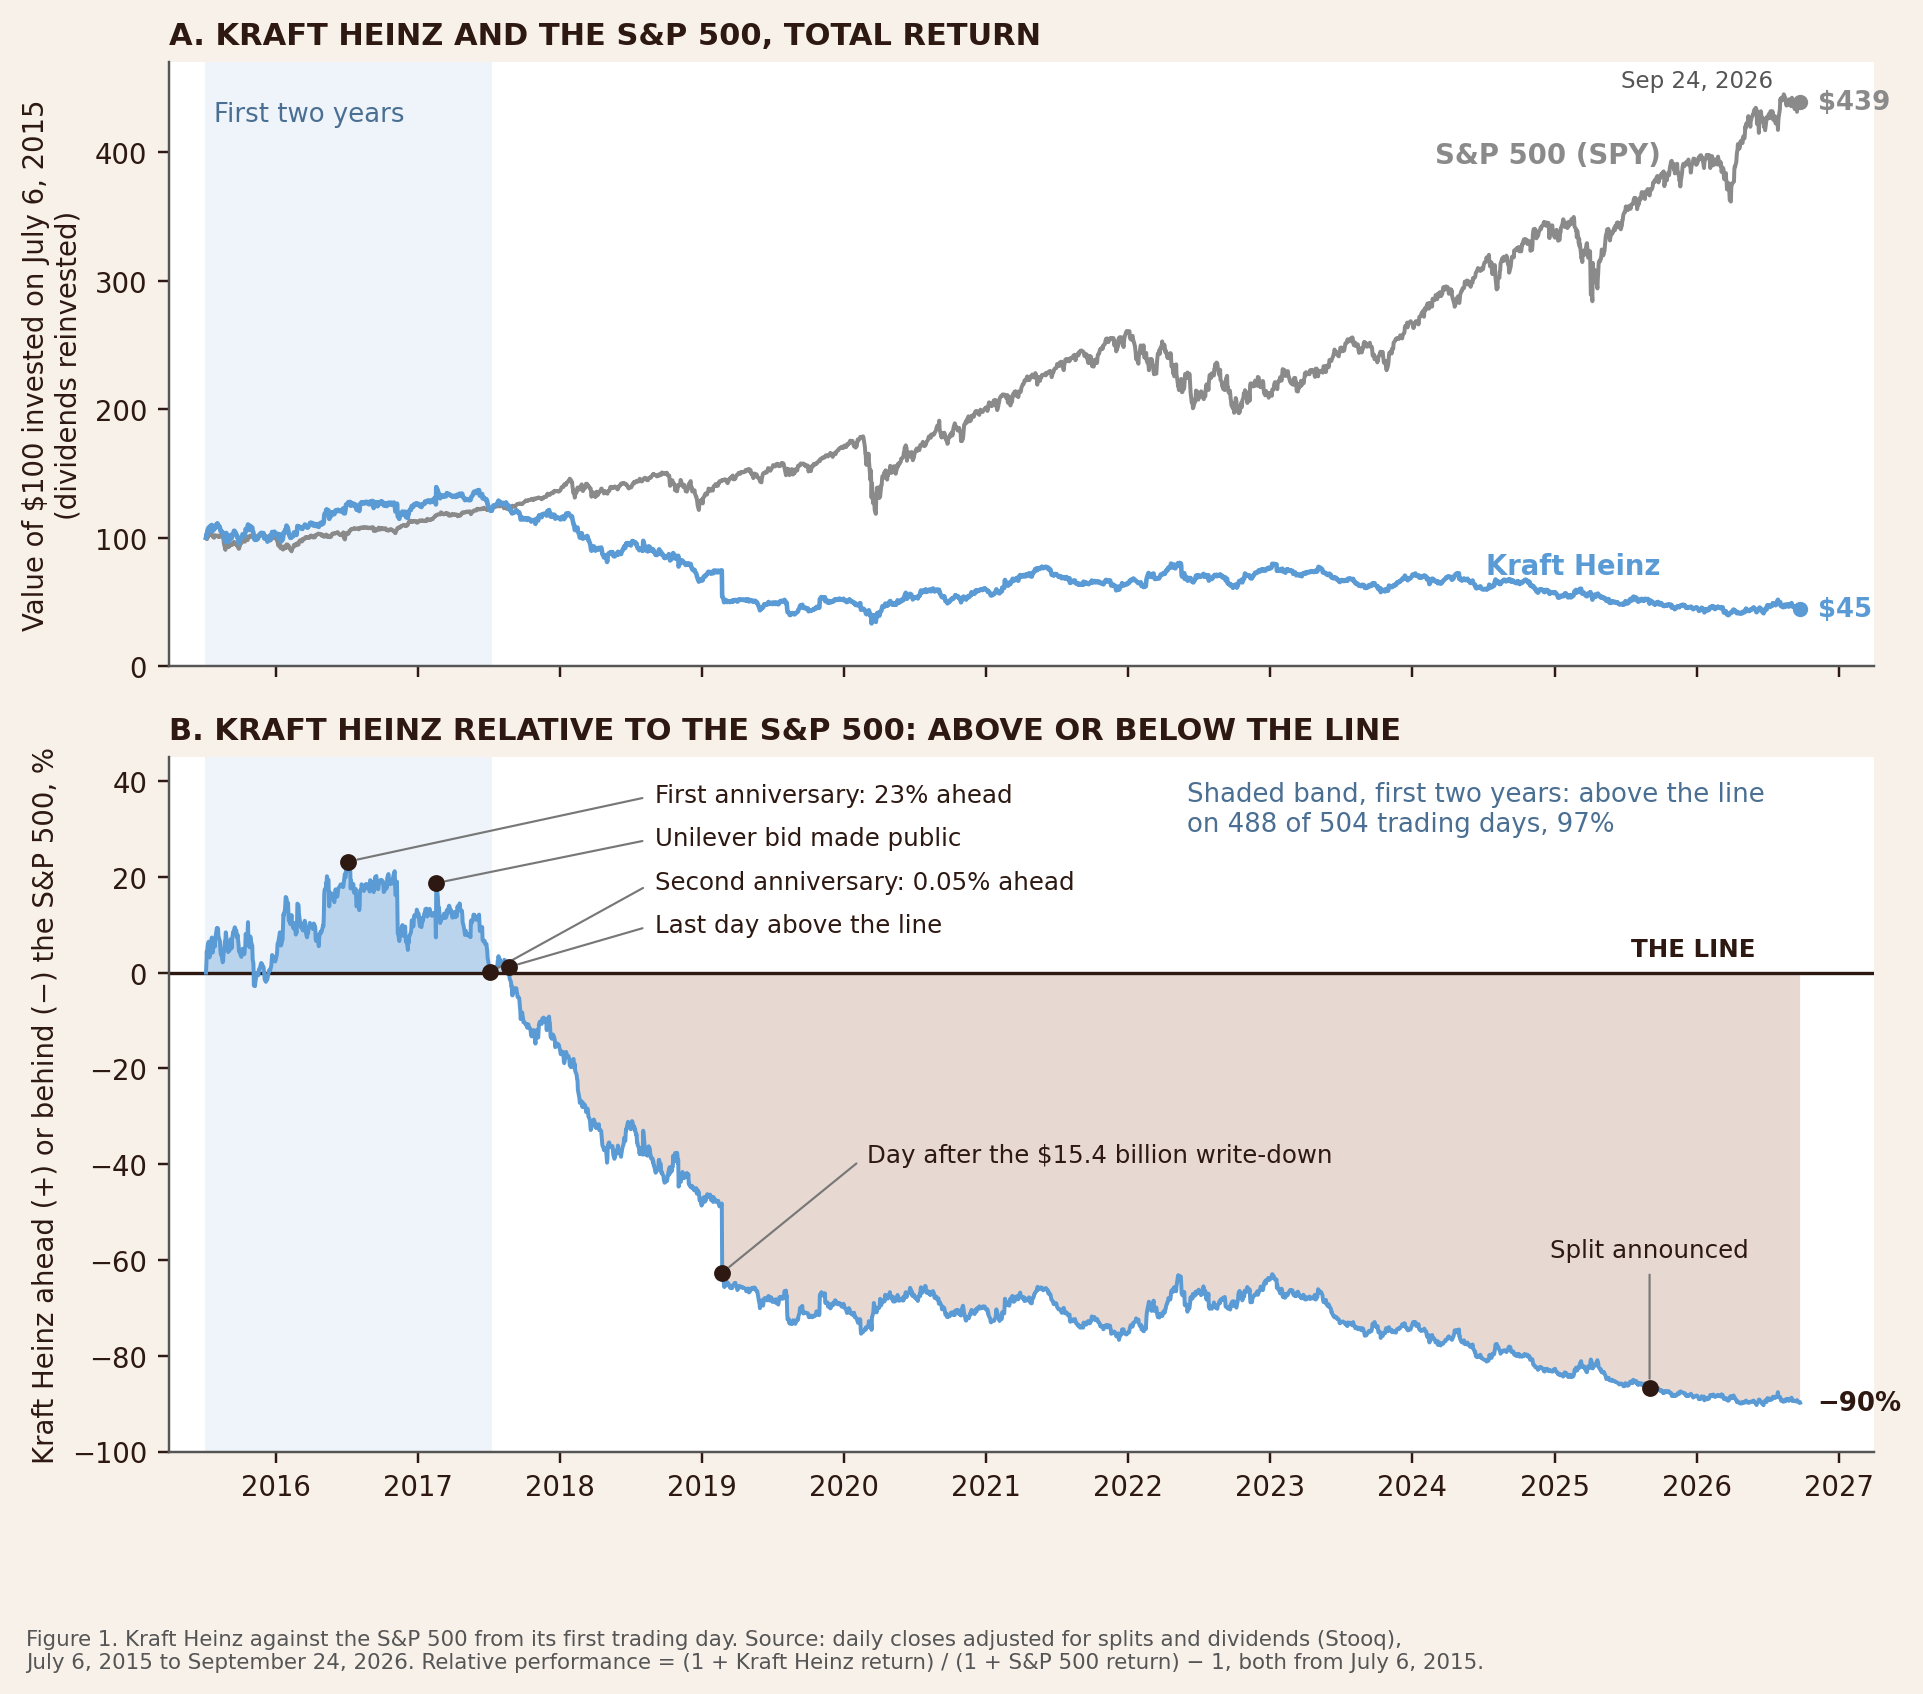
On the morning of July 6, 2015, The Kraft Heinz Company began trading on Nasdaq under the ticker KHC. Four days earlier, Kraft Foods Group had merged into H.J. Heinz Holding Corporation in a combination arranged by 3G Capital and Berkshire Hathaway, putting Kraft, Oscar Mayer, Heinz, Philadelphia and Velveeta under one roof.1 The operating plan was known from the start: run the combined company on zero-based budgeting, in which every expense begins each year at zero and has to be justified again, and turn the savings into margin.2 Take that first day’s closing price and the closing level of the S&P 500 on the same day, and from then on measure one thing only, whether Kraft Heinz shareholders, dividends included, have earned more or less than an investor who bought the index instead. Call the index’s path the line. Over the first two years, 504 trading days, Kraft Heinz sat above the line on 488 of them, ninety-seven percent of the time.3 All sixteen days below fell in November and December of 2015, and from December 14 of that year until the second anniversary the stock did not touch the line once. On the first anniversary it was twenty-three percent ahead of the market. In February 2017 the company made a $143 billion approach to Unilever, a larger rival, and withdrew it two days later when Unilever refused.4 By the second, the lead had shrunk to five hundredths of a percent, but the count of days above the line still read ninety-seven percent, and in the summer of 2017 the chart showed a deal that was working.
The last day Kraft Heinz stood above the line was August 23, 2017, and it has not been above it since. On February 21, 2019, the company reported fourth-quarter results carrying $15.4 billion of non-cash impairment charges, mostly against goodwill and the Kraft and Oscar Mayer trademarks, a quarterly net loss of $12.6 billion, a thirty-six percent cut to the dividend, and a subpoena from the Securities and Exchange Commission concerning its procurement accounting and controls.5 The shares opened the next morning twenty-six percent lower, the largest one-day fall in the company’s history.6 JPMorgan’s Ken Goldman tied the charge to the operating plan, writing that investors had asked for years whether 3G’s “extreme belt-tightening model” would erode the brands, and that the write-down arguably answered the question.7 The pressures on the industry had been reported two years earlier: in its coverage of the Unilever approach, Reuters listed slowing growth, competition from upstart brands and consumers moving toward foods they considered healthier.8 On September 2, 2025, the board announced a plan to split the company in two, undoing much of the merger ten years after it closed, and in February 2026, under a new chief executive, it paused that work to attempt a turnaround instead.9 Measured from the same first morning, Kraft Heinz shareholders have lost fifty-five percent with dividends included, while the S&P 500 has returned three hundred thirty-nine percent, which leaves the stock ninety percent behind the line.3
On paper, every transaction looks great, it wouldn’t have happened otherwise. But when you sell X, your target sells Y, and together you can run both with one set of tools instead of two, the result is rarely as simple as adding the two and keeping the savings. There are things you can’t anticipate until you’re in the middle of the integration, such as different management styles, different cultures and different systems, to name only the obvious ones. Integrating them can be harder than running the two companies separately, which is why the real success or failure of a deal is known only months or years after it closes. In the short and medium term, the stock price has proven to be a poor judge of whether a deal worked. And the chart everyone watches would mislead even if the integration held no surprises at all.
Take two colleagues who bet a dollar on a fair coin every trading day for a year, 252 flips, and keep a running score of who is ahead. Before the first flip, anyone would expect each colleague to be in the lead about half the time, because the coin is fair and neither has an edge. The probability that the split actually lands anywhere between forty and sixty percent is thirteen percent. The probability that one of them spends at least ninety percent of the year ahead is forty-one percent. A year in which one colleague leads on every single day is about twenty times more likely than a year split exactly down the middle, and in a typical year the lead changes hands only five times; in three years out of ten it changes hands twice or less.10 None of this requires either player to be better than the other. It follows from how a running total moves. The lead can only change hands when the score passes back through zero, and the time the score takes to come back to zero has no typical length: most returns are quick, but the occasional excursion lasts long enough to swallow most of the year, and whichever player happened to be ahead when it began stays ahead through all of it.
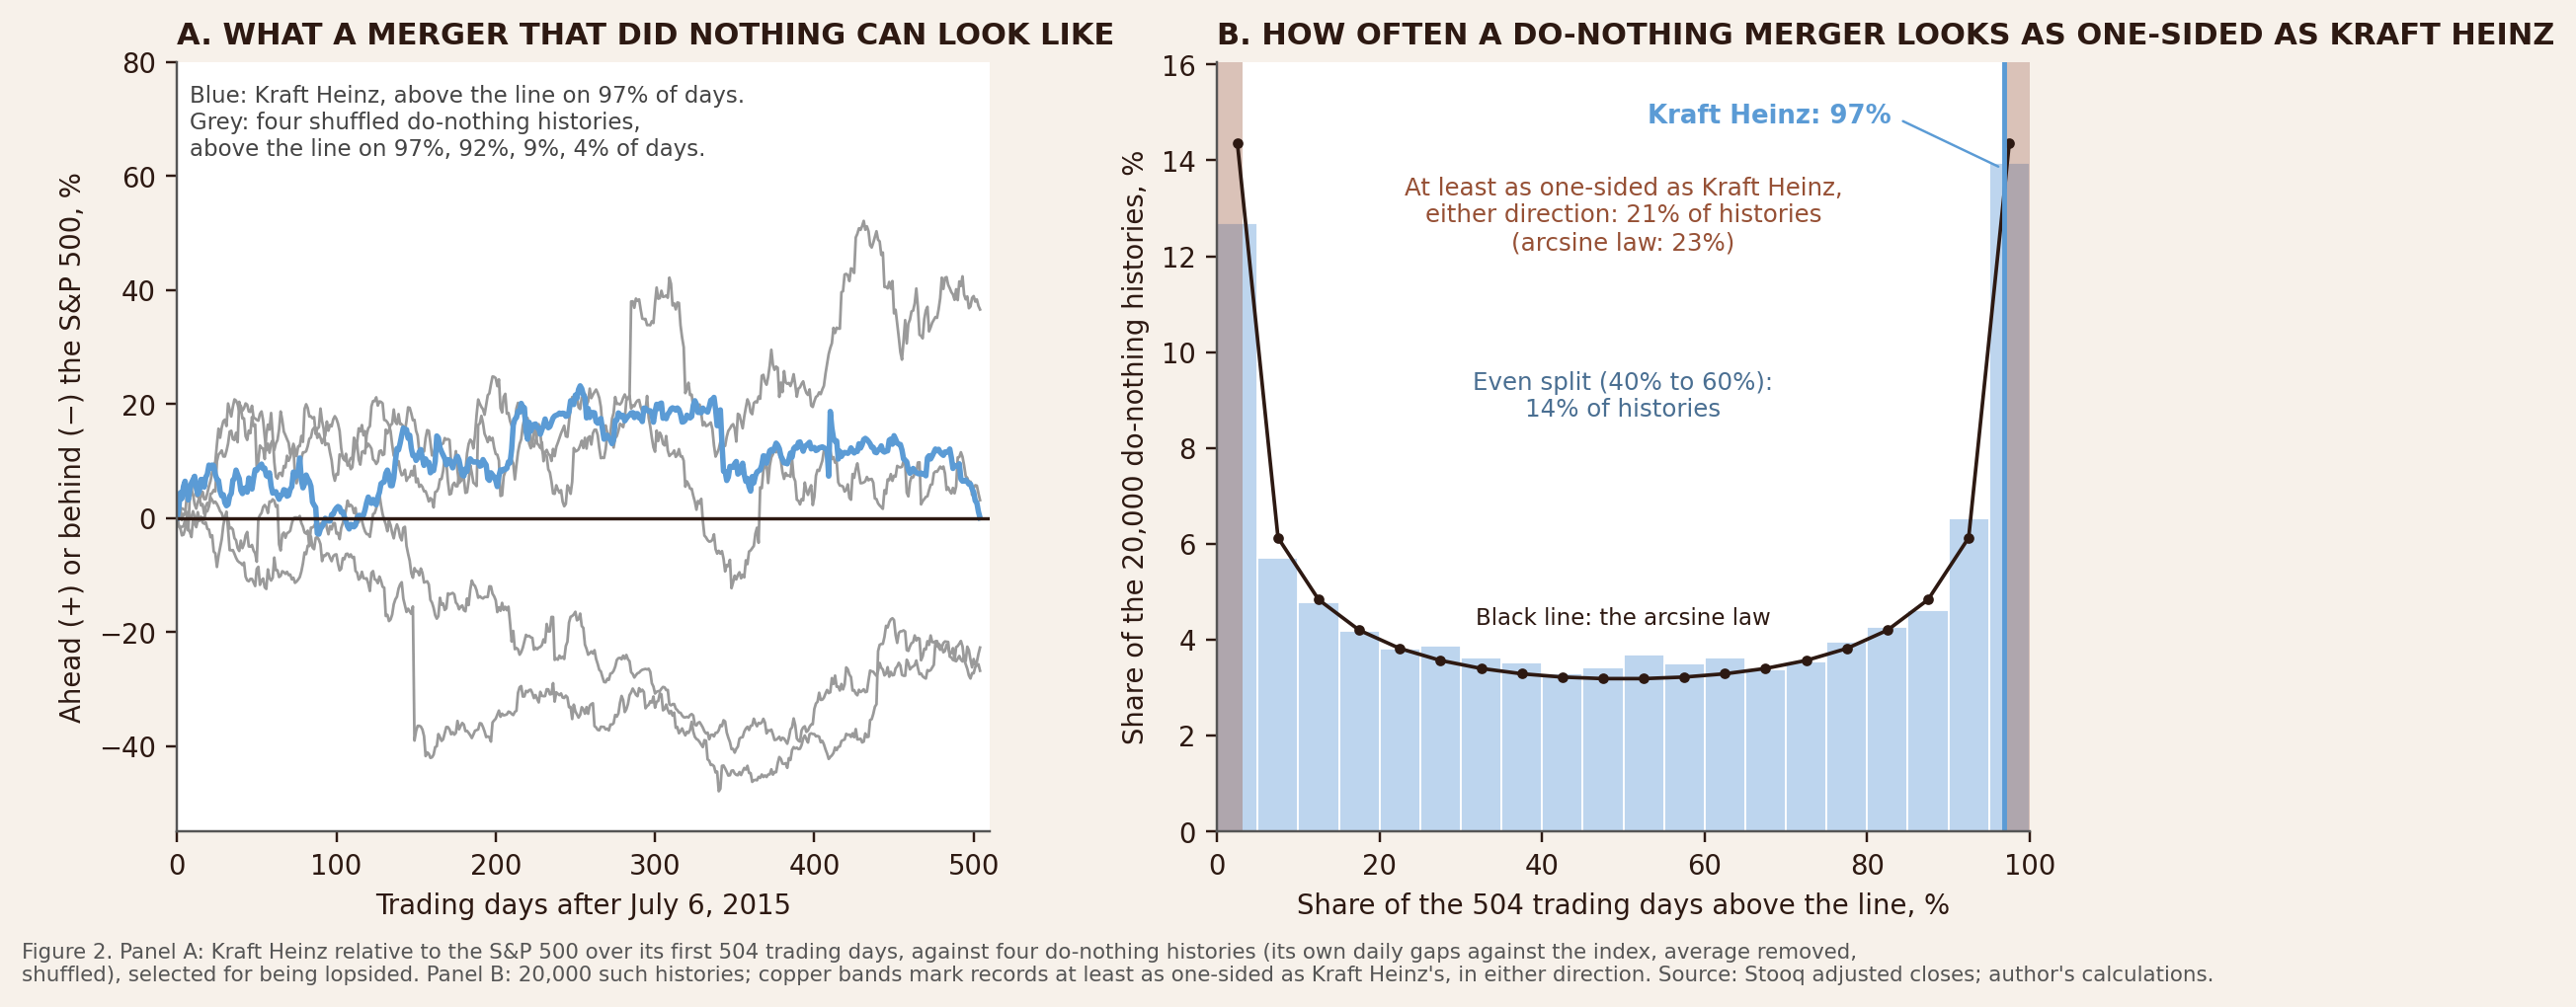
In mathematical terms, the share of time a fair running total spends above zero follows what is called the arcsine law, which Paul Lévy proved for continuous random motion in 1939.11 Its distribution is shaped like a U: the least likely outcome is the even split that intuition expects, and the most likely outcomes are the lopsided ones at either end. The law does not depend on coin flips. Erik Sparre Andersen showed in the 1950s that the same distribution holds for any sequence of independent steps drawn from the same symmetric distribution, so the fat tails and occasional large jumps of daily stock returns leave it unchanged.12 And the relative performance in the lower panel of Figure 1 is exactly such a running total: every trading day adds one step, the gap between that day’s return on Kraft Heinz and that day’s return on the index, and the stock is above the line whenever the steps added so far sum to more than zero.
Apply the law to Kraft Heinz by asking what its chart would have looked like if the merger had done nothing at all. Take the stock’s actual daily gaps against the index over eleven years, subtract their average so that, added together, they neither help nor hurt, and put them in random order to build an alternative two years of history. Each shuffled history is a merger with no effect on value: every day’s move is a real Kraft Heinz move, but the sequence carries no verdict. Repeat it twenty thousand times. About one history in five spends at least ninety-seven percent of its days on one side of the line, above or below, and the arcsine law, computed from its formula alone, gives twenty-three percent.13 The early lead may well have reflected something real. The count of days above the line could not tell anyone whether it did, because a merger that changed nothing produces a count that one-sided about one time in five.
Four large acquisitions closed within ten months of each other: Fiserv’s purchase of First Data on July 29, 2019, Global Payments’ merger with TSYS on September 18, 2019, T-Mobile’s merger with Sprint on April 1, 2020, and AbbVie’s acquisition of Allergan on May 8, 2020. Measure each the way Kraft Heinz was measured, from the day it closed, but against its own industry rather than the whole market: financial stocks for the two payments companies, Verizon for T-Mobile, and the health-care sector for AbbVie. At the first anniversary, when the first verdicts on a deal get written, the four records were almost identical. Fiserv had spent ninety-two percent of its trading days above the line, T-Mobile and AbbVie ninety percent each, and Global Payments eighty-eight, and all four stood ahead of their lines on the anniversary itself, by between ten and thirty percent.14
Today T-Mobile stands ninety-one percent ahead of Verizon, and AbbVie ninety-nine percent ahead of the health-care sector. Fiserv stands seventy-nine percent behind financial stocks, after the worst day in its history in October 2025, when a cut to its growth forecast took forty-four percent off its shares.15 Global Payments stands seventy-four percent behind. In January 2026 it completed the sale of the former TSYS to FIS for $13.5 billion and the purchase of Worldpay, the processor FIS had acquired in 2019, so that six years after the 2019 deals, the businesses at the center of two of them had changed hands between the same two companies.16
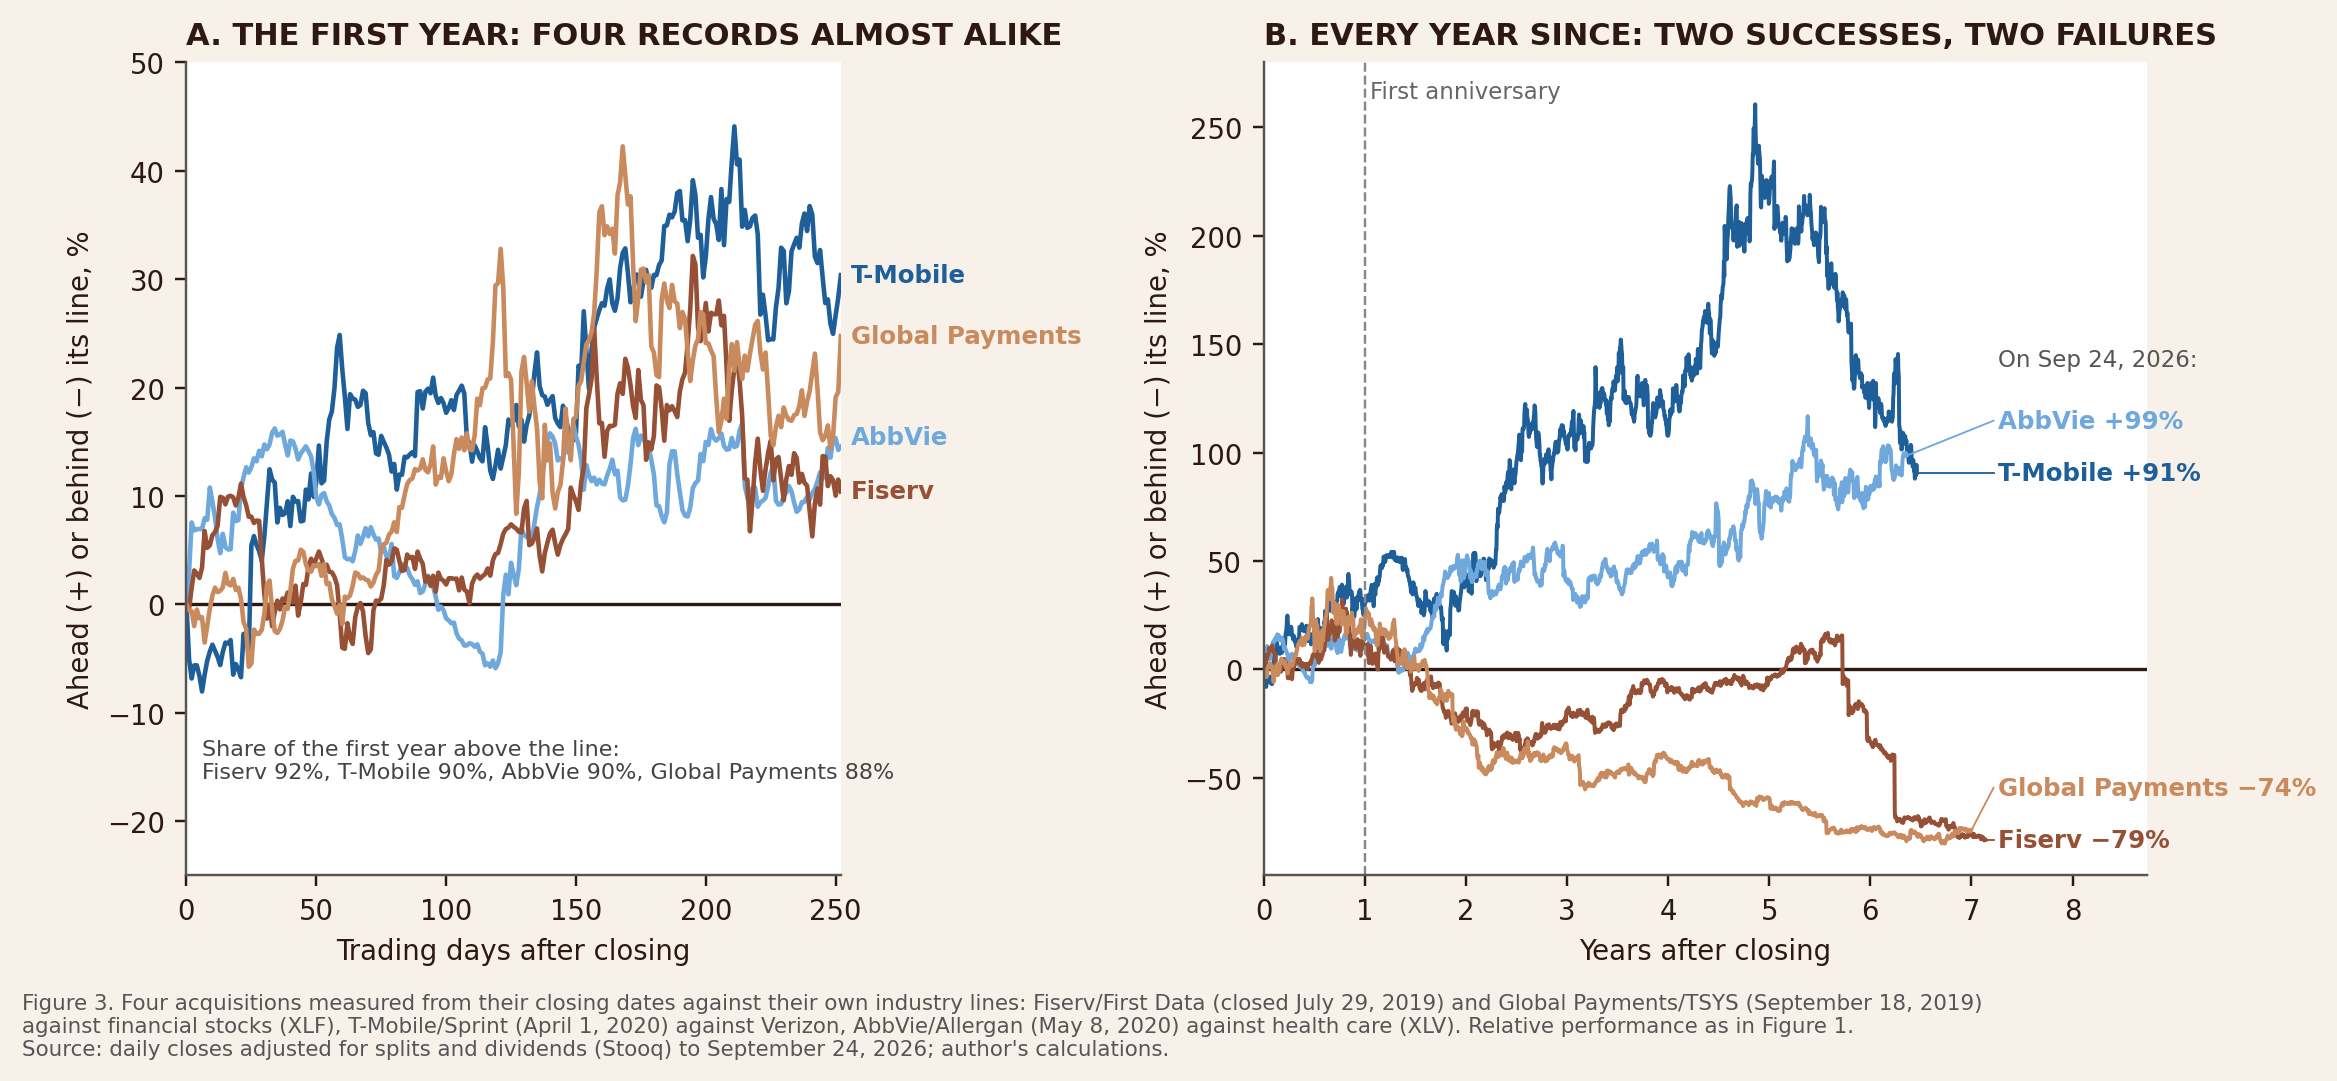
At the first anniversary, the real effect of each deal was still small next to the daily noise. Pure chance alone, with no effect from any deal in it, produces a first-year record at least as one-sided as eighty-eight percent, in one direction or the other, about forty-four percent of the time, so a board looking at any of these four charts was looking at a record that chance produces almost as often as not, and nothing in the count could tell the two deals that would work from the two that would not.17 By the second anniversary the records had begun to pull apart, as the effect of each deal grew large enough to show through the noise.18
In those first two years, T-Mobile spent ninety-five percent of its trading days above Verizon and ninety-one percent below the S&P 500, which returned eighty-nine percent over the period from a start nine days after its pandemic low. The stock and the days are the same, and the two records, about as one-sided as records get, point in opposite directions.19 The market line asks whether shareholders would have done better owning the index. The industry line asks whether the company did better than the businesses that face the same prices, rates and customers, which is closer to asking what the deal itself contributed, and it is the reason the four deals are measured against their industries.
AT&T closed its $85.4 billion purchase of Time Warner on June 14, 2018. Measured against Verizon, it spent ninety-eight percent of its first two years below the line and ninety-nine percent of its first three, and on the third anniversary it stood twenty percent behind. By then it had already agreed to separate WarnerMedia and combine it with Discovery; when that transaction closed in April 2022, AT&T received $40.4 billion in cash and its shareholders received seventy-one percent of the new Warner Bros. Discovery.20 Here the one-sided record was right. It was also a record that pure chance produces about one time in six, which is why, read in 2020, it could not have settled the question by itself.21
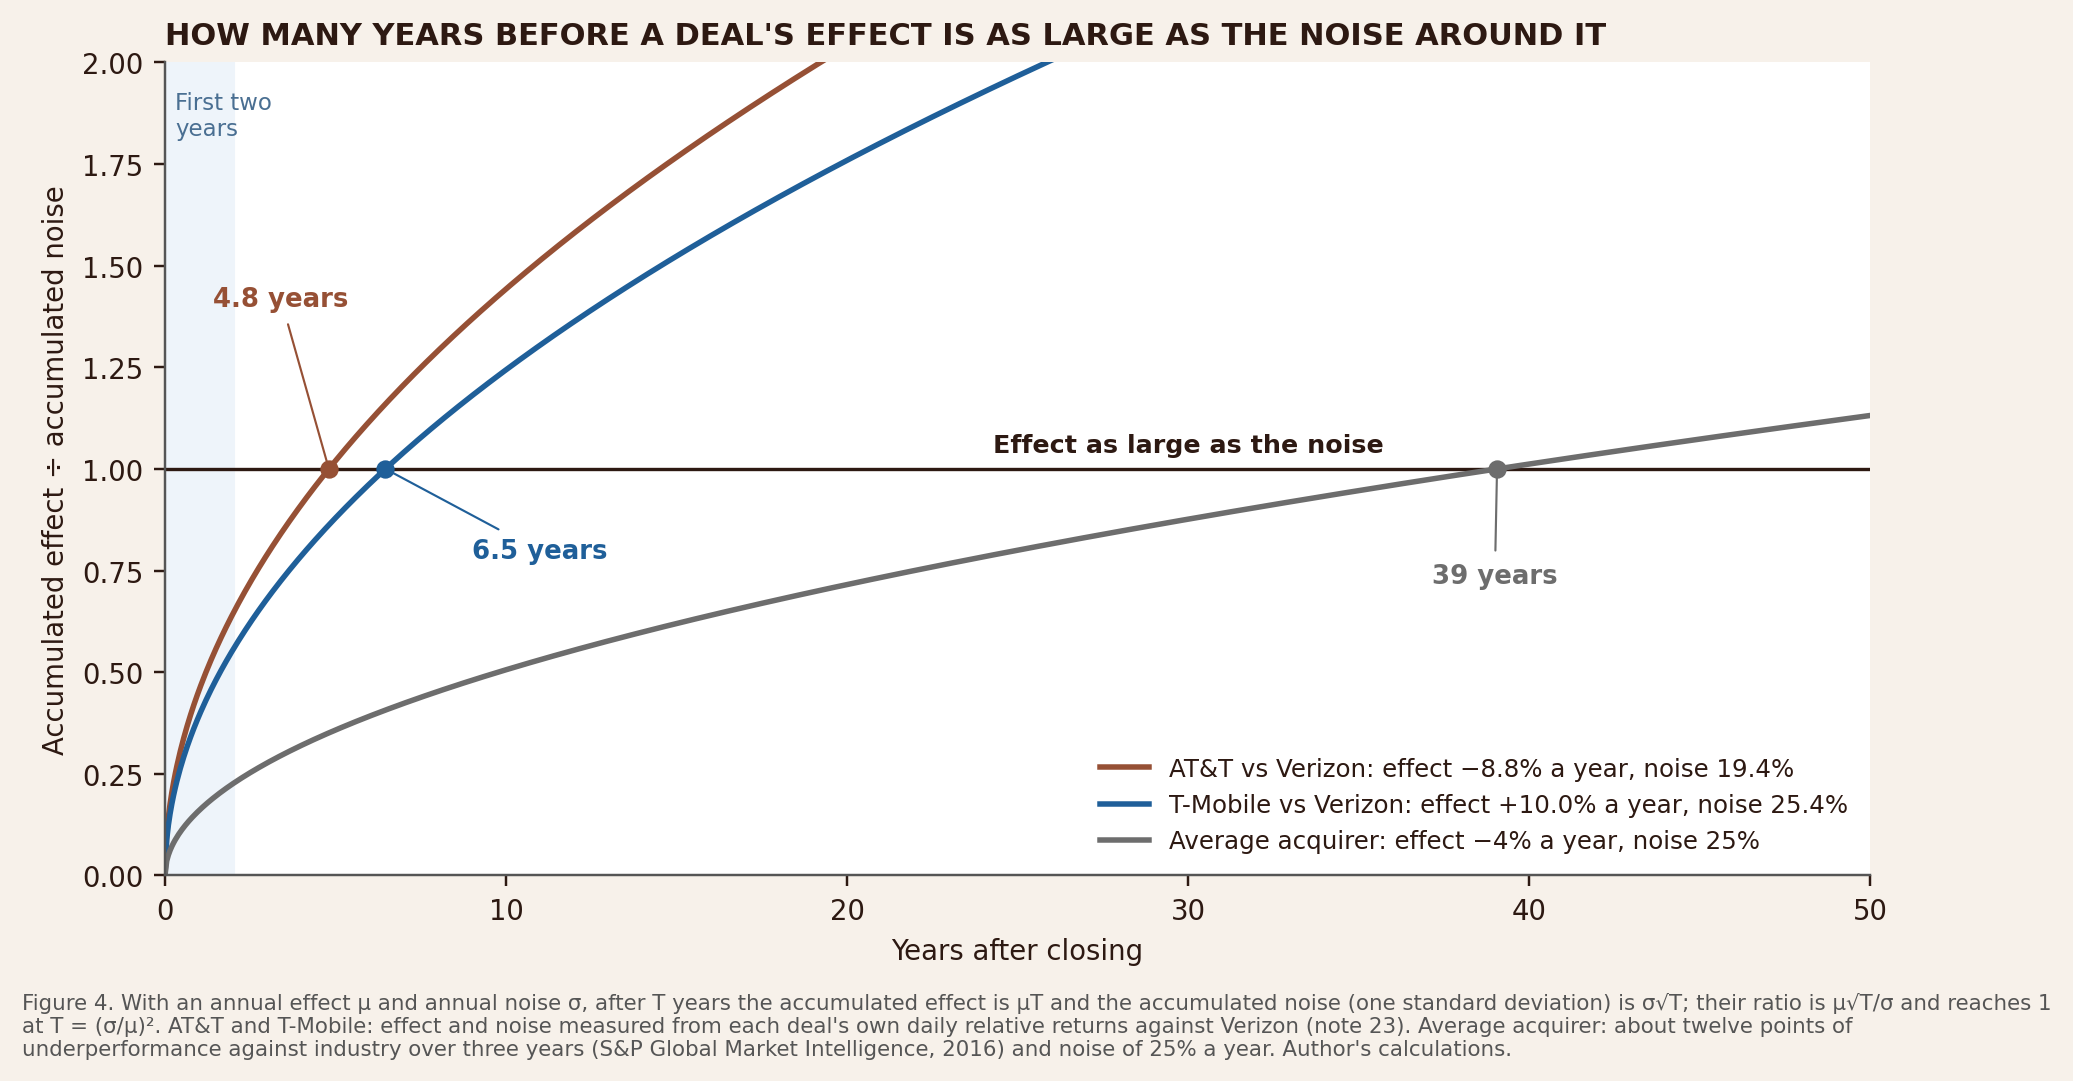
The effect of acquisitions is also real on average. S&P Global Market Intelligence, studying Russell 3000 companies that made acquisitions worth more than five percent of their own enterprise value, found that acquirers trailed their industry peers one, two and three years after closing, by about twelve percentage points after three years.22 The difficulty is scale. Twelve points over three years is about four points a year, while the gap between a single stock and its own industry moves by twenty to thirty-five percent in a typical year among the deals in this essay. A deal’s effect adds up in proportion to time, while the noise around it adds up only with the square root of time. For an effect of four points a year and noise of twenty-five percent a year, the effect after T years is 4T points and the noise about 25√T points, so the stock chart alone cannot show the effect clearly until T reaches thirty-nine years; across the quieter and noisier stocks in this essay, anywhere from about twenty-five to seventy years.23 The market prices the deal every day; what the chart cannot do for years is separate the deal’s share of the move from everything else moving the stock. Deals with larger effects show through sooner. AT&T, whose effect was about nine points a year against noise of nineteen percent, showed through in about five years, and T-Mobile, with ten points a year against noise of twenty-five percent, in six and a half. In every case that point comes years after the first verdicts have been written.
The same arithmetic says how far to trust a first-year chart. For a deal with the average effect, a record that spends most of its first year on one side of the line points in the right direction fifty-six percent of the time, against fifty for a coin, and even a record ninety percent one-sided points the right way only fifty-nine percent of the time. For an effect as large as T-Mobile’s, those figures rise to sixty-three and seventy percent, still wrong in about one case in three.24 The first verdict on a deal is mostly luck.
A one-sided record is therefore what a deal that destroyed value, a deal that created it and a deal that did nothing all produce in their first years, and the count of days above or below the line cannot say which of the three is in front of the reader. What can eventually say it is the size of the gap measured against the noise, together with the time needed for that ratio to mean something.
Capital One closed its acquisition of Discover on May 18, 2025. Measured against financial stocks, it spent seventy-five percent of its first year above the line, and sixteen months after closing it stands six percent behind. Both numbers will be read as verdicts, in one direction or the other, and on the arithmetic above neither can yet say whether the deal works: with noise of about twenty-two percent a year, even an effect as large as T-Mobile’s would need close to five years to show through.25
— Carlos E. Mora
I wake up, I build, I repeat. No guarantees.
I work like it’s all on the line, because it is.
Family is the only true legacy.
Your name is your currency, and it must be earned daily.
1.The Kraft Heinz Company, Form 10-K for fiscal 2025, Item 1 (merger consummated July 2, 2015).
2.On 3G’s zero-based budgeting at Kraft Heinz: Journal of Forensic and Investigative Accounting, 2023, Issue 3, “Kraft Heinz Company and the $15.4 Billion Impairment Charge.”
3.Daily closes adjusted for splits and dividends (Stooq), July 6, 2015 to September 24, 2026. Relative performance on day t is ln(Pₜ/P₀) − ln(Iₜ/I₀), where P is Kraft Heinz and I the S&P 500 (SPY); the stock is above the line when this is positive. Of the first 504 trading days, 488 were above; the sixteen below fell between November 6 and December 11, 2015. Relative lead: +23.2% on July 6, 2016; +0.05% on July 5, 2017. Last day above: August 23, 2017. Total return to September 24, 2026: Kraft Heinz −55.3%, SPY +339.1%, relative −89.8%.
4.Associated Press, February 19, 2017 (Kraft Heinz’s $143 billion approach to Unilever, withdrawn after Unilever’s rejection).
5.Kraft Heinz, Form 8-K, February 21, 2019, Exhibit 99.1 (impairment and net loss); dividend cut and subpoena per Associated Press, February 22, 2019.
6.Associated Press, February 22, 2019.
7.Ken Goldman, JPMorgan, as quoted by CNBC, February 22, 2019.
8.Reuters, February 18, 2017, coverage of the Kraft Heinz approach to Unilever.
9.Kraft Heinz, Form 8-K, September 2, 2025, Exhibit 99.1; Form 10-K for fiscal 2025, Item 1 (separation work paused February 11, 2026).
10.Exact probabilities for 252 fair steps from the discrete arcsine distribution (William Feller, An Introduction to Probability Theory and Its Applications, Vol. I, 3rd ed., 1968, ch. III): share of time ahead between 40% and 60%, 12.7%; one side ahead at least 90% of the time, 41.1%; one side ahead all 252 days, 10.0%, against 0.50% for an exact 50/50 split. Lead changes from 20,000 simulated years: median 5; two or fewer in 29.6% of years. The continuous limits are 12.8% and 41.0%.
11.Paul Lévy, “Sur certains processus stochastiques homogènes,” Compositio Mathematica 7 (1939–40), pp. 283–339. For a driftless continuous walk, the probability that the share of time above zero is at most x equals (2/π)·arcsin √x.
12.Erik Sparre Andersen, “On the fluctuations of sums of random variables,” Mathematica Scandinavica 1 (1953), pp. 263–285, and 2 (1954), pp. 195–223. For independent steps from any symmetric continuous distribution, the number of days the running total spends above zero has the same distribution as in the coin-flip game. The assumptions real returns violate, drift and dependence between days, are taken up in “When Below the Line Is the Truth.”
13.Kraft Heinz spent 96.83% of its first 504 trading days above the line. Continuous two-sided tail: 2[1 − (2/π)·arcsin √0.9683] = 22.8%; exact discrete value for 504 steps, 23.9%. Resampling check: 20,000 random draws of 504 daily relative returns from Kraft Heinz’s full 2015–2026 history, each demeaned to remove drift, produced a record at least that one-sided in 21.4% of cases (Figure 2, panel B).
14.Closing dates: Fiserv, Form 8-K, July 29, 2019; Global Payments, Form 8-K, September 18, 2019; T-Mobile, company release, April 1, 2020; AbbVie, Form 8-K, May 8, 2020. Lines: Financial Select Sector SPDR (XLF) for Fiserv and Global Payments, Verizon (VZ) for T-Mobile, Health Care Select Sector SPDR (XLV) for AbbVie; same data and method as note 3. First year = 252 trading days after the closing-date close. Days above the line: Fiserv 232 (92.1%), T-Mobile 228 (90.5%), AbbVie 227 (90.1%), Global Payments 223 (88.5%). Relative position on the first anniversary: +10.4%, +30.4%, +14.5%, +24.8%. Relative position on September 24, 2026: Fiserv −78.6%, Global Payments −74.1%, T-Mobile +90.7%, AbbVie +98.7%.
15.Fiserv third-quarter 2025 results and revised guidance, October 29, 2025: 2025 organic revenue growth forecast cut from about 10% to 3.5%–4%, with leadership changes announced the same day; share reaction as reported by Barron’s, Reuters and TIKR.
16.Global Payments, Form 8-K, April 17, 2025 (Issuer Solutions to FIS at an enterprise value of $13.5 billion; Worldpay at $24.25 billion); shares fell more than 17% on the announcement (Fortune, April 17, 2025); completion per Global Payments and FIS releases, January 12, 2026. FIS had acquired Worldpay on July 31, 2019.
17.Two-sided arcsine tail at the least one-sided of the four records: 2[1 − (2/π)·arcsin √0.885] = 44.1%. For the other three: Fiserv 36.4%, T-Mobile 39.9%, AbbVie 40.8%.
18.Share of the first two years above the line: T-Mobile 95.2%, AbbVie 93.1%, Global Payments 74.0%, Fiserv 67.9%. Relative position on the second anniversary: +43.3%, +50.3%, −27.8%, −18.6%.
19.T-Mobile, April 1, 2020 to March 31, 2022 (504 trading days), total returns with dividends: T-Mobile +50.8%, Verizon +5.2%, S&P 500 (SPY) +88.9%; SPY’s 2020 closing low was on March 23, 2020. Days above the line: against Verizon 480 of 504 (95.2%); against SPY 46 of 504 (9.1%). Relative position on September 24, 2026: +90.7% against Verizon, −42.1% against SPY. The same exercise on Kraft Heinz with consumer staples (XLP) in place of the S&P 500: above the line on 134 of its first 252 trading days (53.2%) and 386 of its first 504 (76.6%), against 96.8% for the S&P 500; relative position on September 24, 2026, −78.3%.
20.AT&T: purchase price per the October 22, 2016 announcement; completion June 14, 2018 (AT&T, Form 10-Q, second quarter 2018). Days below Verizon: 496 of the first 504 trading days (98.4%) and 748 of the first 756 (98.9%); relative position on June 16, 2021, −19.6%. WarnerMedia agreement May 17, 2021; completion April 8, 2022, with $40.4 billion in cash to AT&T and 0.241917 Warner Bros. Discovery shares per AT&T share, about 71% of the new company (AT&T, Form 8-K and Form 10-Q, first quarter 2022). AT&T’s price series after April 8, 2022 is not used, because the distribution of Warner Bros. Discovery shares distorts it (see note 3 for the data source).
21.Two-sided arcsine tail for a two-year record of 98.4% on one side: 2[1 − (2/π)·arcsin √0.984] = 16.1%.
22.S&P Global Market Intelligence, Quantamental Research, “Mergers & Acquisitions: The Good, the Bad, and the Ugly (And How to Tell Them Apart),” August 2016: Russell 3000 acquirers making acquisitions greater than 5% of their enterprise value; underperformance against industry peers at one, two and three years after closing. The three-year figure of about 12 percentage points against industry is as summarized by IFRE; within the study, acquirers paying mostly in stock trailed peers by 3.3% after one year and 8.1% after three.
23.Annualized standard deviation of daily relative log returns against each deal’s line: AT&T–Verizon 19.4% (June 14, 2018 to April 7, 2022), Kraft Heinz–consumer staples 22.0%, T-Mobile–Verizon 25.4%, Kraft Heinz–S&P 500 26.3%, Fiserv–financials 33.9% (to September 24, 2026). With an annual effect μ and annual noise σ, the accumulated effect μT equals one standard deviation of accumulated noise, σ√T, when T = (σ/μ)². AT&T: μ = −8.8% a year, T = 4.8 years; T-Mobile: μ = +10.0% a year, T = 6.5 years (μ measured over each full period shown). Average effect: μ = 4% a year, σ = 25%, T = 39 years. Sensitivity of the average case to noise: σ = 19.4% gives 23.5 years; σ = 25% gives 39.1; σ = 33.9% gives 71.8. See Figure 4.
24.Simulation of 40,000 paths per case, daily steps over 252 trading days a year, each path a random walk with annual drift μ and annual noise σ (seed fixed; script retained). Average acquirer (μ = 4%, σ = 25%): first-year majority of days on the side of the true effect, 55.7%; share of first-year records at least 90% one-sided, 42.0%, of which 58.9% point the right way; at two years, 56.9% and 60.5%. Large effect (μ = 10%, σ = 25%): 62.8% and 69.8% at one year; 67.9% and 76.4% at two. With no effect, every figure is 50% by symmetry. For comparison, the probability that the relative position itself is on the right side after T years is Φ(μ√T/σ): 56.4% for the average case at one year. The model assumes independent daily steps and a constant effect; real effects vary by deal, and larger effects give better odds.
25.Capital One, Form 10-K for fiscal 2025 (acquisition of Discover closed May 18, 2025). Against XLF from the May 16, 2025 close, the last close before completion: above the line on 190 of the first 252 trading days (75.4%) and 198 of 340 through September 24, 2026 (58.2%); relative position on September 24, 2026, −5.7%. Annualized noise of daily relative log returns, 21.8%; with μ = 10% a year, T = (0.218/0.10)² = 4.8 years.
The arithmetic in these essays is the arithmetic the practice runs on a mandate.
Discuss a mandate →